Hi, I am getting the following error every time I run this R script on Power BI Service. It was supposed to be a histogram filtered by categories. Here is the error:
[Monitor] Loaded provider: [DnsStreamProvider] [Monitor] Loaded provider: [HttpServerStreamProvider] [Monitor] Loaded provider: [ClockStreamProvider] [Monitor] Loaded provider: [ResourceManager] [Monitor] Loaded Security Monitor Profile: [C:\Sandboxing\Sandboxes\edb9034d-7d4e-4691-a704-ef7bbff462e5\Profile\0.dbconfig] [Monitor] Writable folder: [file:///Users] => [C:\Sandboxing\Sandboxes\edb9034d-7d4e-4691-a704-ef7bbff462e5\Users] [Monitor] Writable folder: [file:///Results] => [C:\Sandboxing\Sandboxes\edb9034d-7d4e-4691-a704-ef7bbff462e5\Results] [Monitor] Writable folder: [file:///Work] => [C:\Sandboxing\Sandboxes\edb9034d-7d4e-4691-a704-ef7bbff462e5\Work] [Monitor] R/O folder: [file:///ThirdParty] => [C:\WFRoot\SBRole.0\Fabric\work\Applications\ASAzureApp_App0\temp\R_Root_13.0.2201.174] [Monitor] R/O folder: [file:///Script] => [C:\Sandboxing\Sandboxes\edb9034d-7d4e-4691-a704-ef7bbff462e5\Script] [Monitor] R/O folder: [file:///InputData] => [C:\Sandboxing\Sandboxes\edb9034d-7d4e-4691-a704-ef7bbff462e5\InputData] [Monitor] Scratch folder: [C:\Sandboxing\Sandboxes\edb9034d-7d4e-4691-a704-ef7bbff462e5\Scratch] [Monitor] Driver version: [1.0.2108.0] (retail build) [Monitor] Loaded package: [NT.6.2.9200.2108.0.Picoprocess (x64)] [Monitor] Loaded package: [WindowsGUI.6.2.9200.0.0.Stub (x64)] [Monitor] Loaded package: [WindowsGUI.6.2.9200.0.0.Stub (x86)] [Monitor] Loaded package: [InvokeR.exe.0.0.0.0.0 (x64)] [Monitor] Loaded package: [Windows.6.2.9200.2108.0 (x64)] [Monitor] Loaded package: [Drawbridge.1.0.2108.2108.0.Secure (x64)] [Monitor] Loaded package: [WindowsCommon.6.2.9200.2108.0 (x64)] [Monitor] Loaded package: [WindowsCertificates.6.2.9200.2108.0 (x64)] [Monitor] Loaded package: [InternetExplorerOS.8.0.7600.2108.0.IE8 (x64)] [Monitor] Launching app: [/InvokeR.exe] Error occurred attempting to evaluate the script [Monitor:WARNING] Application 'InvokeR.exe /InvokeR.exe C:\Script\0.R' exited with non-zero code 0x1. [Monitor] Done.
https://wabi-brazil-south-redirect.analysis.windows.net
And this is the screenshot of the expected result. I blurred my data on purpose.
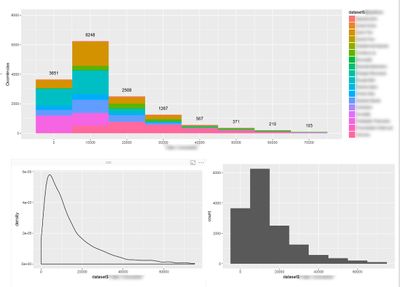
The bottom two charts are rendered OK. Only on the top one I get this error. How can this be fixed?
UPDATE (30/08/2017):
Many other visuals display a Runtime Error with the same error message: barcharts, dotplot, linecharts with the same data using ggplot2.
While trying to build a correlation Matrix, it again works on my desktop, but not on the online service. The error I get in this case is "Error: Aesthetics must be either length 1 or the same as the data (51188): colour, x, y, label In addition: Warning message: package 'ggplot2' was built under R version 3.2.5".

 on:
Dataflow error communicating with another service
on:
Dataflow error communicating with another service
 yanlinnnaing
on:
Issue: Oracle Cloud Connection created without cen...
yanlinnnaing
on:
Issue: Oracle Cloud Connection created without cen...