Hello,
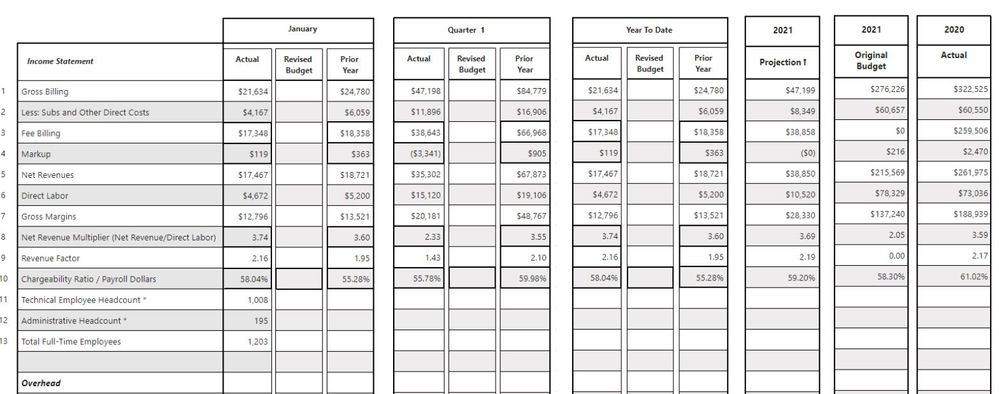
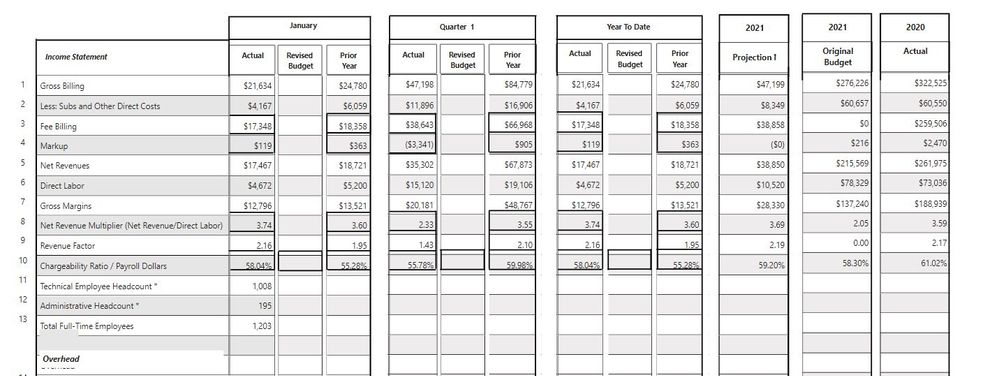
I have a financial dashboard where there are 12 matrix visuals overlapped on each other. There are some text boxes also overlapping the matrix visuals. It is often observed that the same report gets displayed differently in different laptops. The lines keep changing, overlapping text boxes are often misplaced. I've tried grouping the items together but the situation remained same. I'm attaching screenshots regarding how the visuals are getting displayed in different laptops. PowerBI Desktop version, laptop models are same. Not sure why this is happening. Kindly provide some fix.
Screenshot 1:
Screenshot 2:
Regards,
RB


 on:
Dataflow error communicating with another service
on:
Dataflow error communicating with another service
 yanlinnnaing
on:
Issue: Oracle Cloud Connection created without cen...
yanlinnnaing
on:
Issue: Oracle Cloud Connection created without cen...
 on:
Option to set key column is missing in June 2026 r...
on:
Option to set key column is missing in June 2026 r...