- Power BI forums
- Updates
- News & Announcements
- Get Help with Power BI
- Desktop
- Service
- Report Server
- Power Query
- Mobile Apps
- Developer
- DAX Commands and Tips
- Custom Visuals Development Discussion
- Health and Life Sciences
- Power BI Spanish forums
- Translated Spanish Desktop
- Power Platform Integration - Better Together!
- Power Platform Integrations (Read-only)
- Power Platform and Dynamics 365 Integrations (Read-only)
- Training and Consulting
- Instructor Led Training
- Dashboard in a Day for Women, by Women
- Galleries
- Community Connections & How-To Videos
- COVID-19 Data Stories Gallery
- Themes Gallery
- Data Stories Gallery
- R Script Showcase
- Webinars and Video Gallery
- Quick Measures Gallery
- 2021 MSBizAppsSummit Gallery
- 2020 MSBizAppsSummit Gallery
- 2019 MSBizAppsSummit Gallery
- Events
- Ideas
- Custom Visuals Ideas
- Issues
- Issues
- Events
- Upcoming Events
- Community Blog
- Power BI Community Blog
- Custom Visuals Community Blog
- Community Support
- Community Accounts & Registration
- Using the Community
- Community Feedback
Register now to learn Fabric in free live sessions led by the best Microsoft experts. From Apr 16 to May 9, in English and Spanish.
- Power BI forums
- Issues
- Issues
- Secondary Y-Axis Combo Chart
- Subscribe to RSS Feed
- Mark as New
- Mark as Read
- Bookmark
- Subscribe
- Printer Friendly Page
- Report Inappropriate Content
Secondary Y-Axis Combo Chart
Hi Team,
We are facing a peculiar issue right now in one of the reports we have created.
We created a Combo chart using the data from an Analysis services Cube and we are using the Primary and Secondary Y-axis to plot the values in the chart.
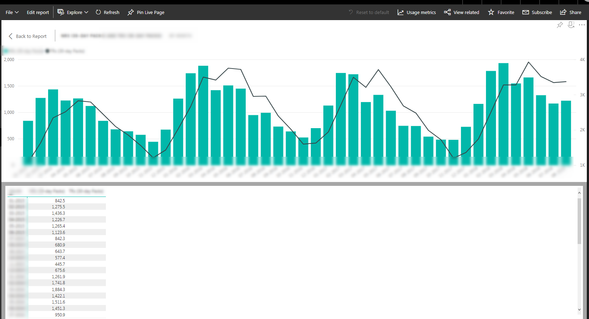
When we click on show data on this chart from PowerBI desktop, we are able to see the values in the table for the primary and secondary Y-axis, but once we publish this report to web, the secondary y-axis values are not showing up in the table as shown in the attached screenshot.
Could you please let us know is there something we should do from our end to resolve this or is this an issue with the Power BI itself, if so could you also please let us know when this could be resolved?
Regards,
Ashwin Vasudevan
- « Previous
-
- 1
- 2
- Next »
- « Previous
-
- 1
- 2
- Next »
You must be a registered user to add a comment. If you've already registered, sign in. Otherwise, register and sign in.
- Illubillu9 on: Sight Care Reviews 2024 Read Before Buying
- New7356ye on: fReE!!^AmAzOn gIfT CaRd cOdEs fReE ToDaY 2024
- New7356ye on: [UPDAT] Best Buy Gift Card Generator 2024
- cddvfbgb on: [LIVESTREAMs!]+ Dortmund v PSG Live free Football ...
- jondfdfd on: [LIVESTREAMs!]+ Dortmund vs PSG Live Football Game...
- jondfdfd on: +>!Here's Way To PSG vs Borussia Dortmund Live Str...
- d4t0r on: free **v bucks generator 2024 free vbucks codes
- fhtino on: Parquet file locked after importing into Power BI ...
-
 v-yetao1-msft
on:
Power Bi - Auto Refresh
- basarahmed507 on: FrEE. PSG-Dortmund Match En Direct la demi-finale ...
- New 8,071
- Needs Info 3,364
- Investigating 3,146
- Accepted 2,036
- Declined 38
- Delivered 3,755
-
Reports
9,703 -
Dashboards
3,983 -
Data Modeling
3,925 -
Gateways
2,076 -
APIS and Embedding
2,048 -
Report Server
2,028 -
Custom Visuals
1,829 -
Content Packs
631 -
Mobile
399 -
Need Help
11 -
Show and Tell
2 -
General Comment
2 -
Tips and Tricks
1 -
Power BI Desktop
1
