skip to main content
Power BI
    • What is Power BI
    • Why Power BI
    • Customer stories
    • Data visuals
    • Security
    • Power BI Desktop
    • Power BI Pro
    • Power BI Premium
    • Power BI Mobile
    • Power BI Embedded
    • Power BI Report Server
  • Pricing
    • Azure + Power BI
    • Microsoft 365 + Power BI
    • Dynamics 365 + Power BI
      • Energy
      • Healthcare
      • Manufacturing
      • Media
      • Retail
    • For analysts
    • For IT
      • Overview
      • Embedded analytics
      • Power BI visuals
      • Automation
      • Documentation
      • Community
    • Overview
    • Find consulting services
    • Partner showcase
    • Find a partner
    • Become a partner
    • Instructor-led training
    • Getting started
      • Overview
      • Online workshops
      • Self-guided learning
      • Webinars
      • Documentation
      • Roadmap
      • Overview
      • Issues
      • Give feedback
    • Blog
    • Business intelligence topics
    • Overview
    • Forums
    • Galleries
    • Submit ideas
    • Events
    • User groups
    • Community blog
    • Register
    • ·
    • Sign in
    • ·
    • Help
    Go To
    • Microsoft Power BI Community
    • Welcome to the Community!
    • News & Announcements
    • Get Help with Power BI
    • Desktop
    • Service
    • Report Server
    • Power Query
    • Mobile Apps
    • Developer
    • DAX Commands and Tips
    • Custom Visuals Development Discussion
    • Health and Life Sciences
    • Power BI Spanish Community
    • Translated Spanish Desktop
    • Power Platform Integration - Better Together!
    • Power Platform Integrations
    • Power Platform and Dynamics 365 Integrations
    • Training and Consulting
    • Instructor Led Training
    • Galleries
    • Community Connections & How-To Videos
    • COVID-19 Data Stories Gallery
    • Themes Gallery
    • Data Stories Gallery
    • R Script Showcase
    • Webinars and Video Gallery
    • Quick Measures Gallery
    • 2021 MSBizAppsSummit Gallery
    • 2020 MSBizAppsSummit Gallery
    • 2019 MSBizAppsSummit Gallery
    • Events
    • Ideas
    • Custom Visuals Ideas
    • Issues
    • Issues
    • Events
    • Upcoming Events
    • Community Engagement
    • T-Shirt Design Challenge 2023
    • Community Blog
    • Power BI Community Blog
    • Custom Visuals Community Blog
    • Community Support
    • Community Accounts & Registration
    • Using the Community
    • Community Feedback
    cancel
    Turn on suggestions
    Auto-suggest helps you quickly narrow down your search results by suggesting possible matches as you type.
    Showing results for 
    Search instead for 
    Did you mean: 
    • Microsoft Power BI Community
    • Galleries
    • R Script Showcase
    New Message
    Options
    • Mark all as New
    • Mark all as Read
    • Float this item to the top
    • Subscribe
    • Bookmark
    • Subscribe to RSS Feed
    • Threaded format
    • Linear Format
    • Sort by Topic Start Date
    • « Previous
      • 1
      • 2
    • Next »
    Recently posted Featured Top Kudos
    View Video
    Bubble chart in R
    ankitpatira
    
    4
    View Video
    Show Different styles of SubPlots in a Map
    leilaetaati
    
    1
    View Video
    Using R scripts to show 5 different dimensions in a single Chart
    leilaetaati
    
    2
    View Video
    Distribution of NAs in Timeseries (impute TS) Work good with very large Data
    Rob-van-Breemen
    
    0
    View Video
    PunchCard Chart in R
    hugoberry
    
    0
    View Video
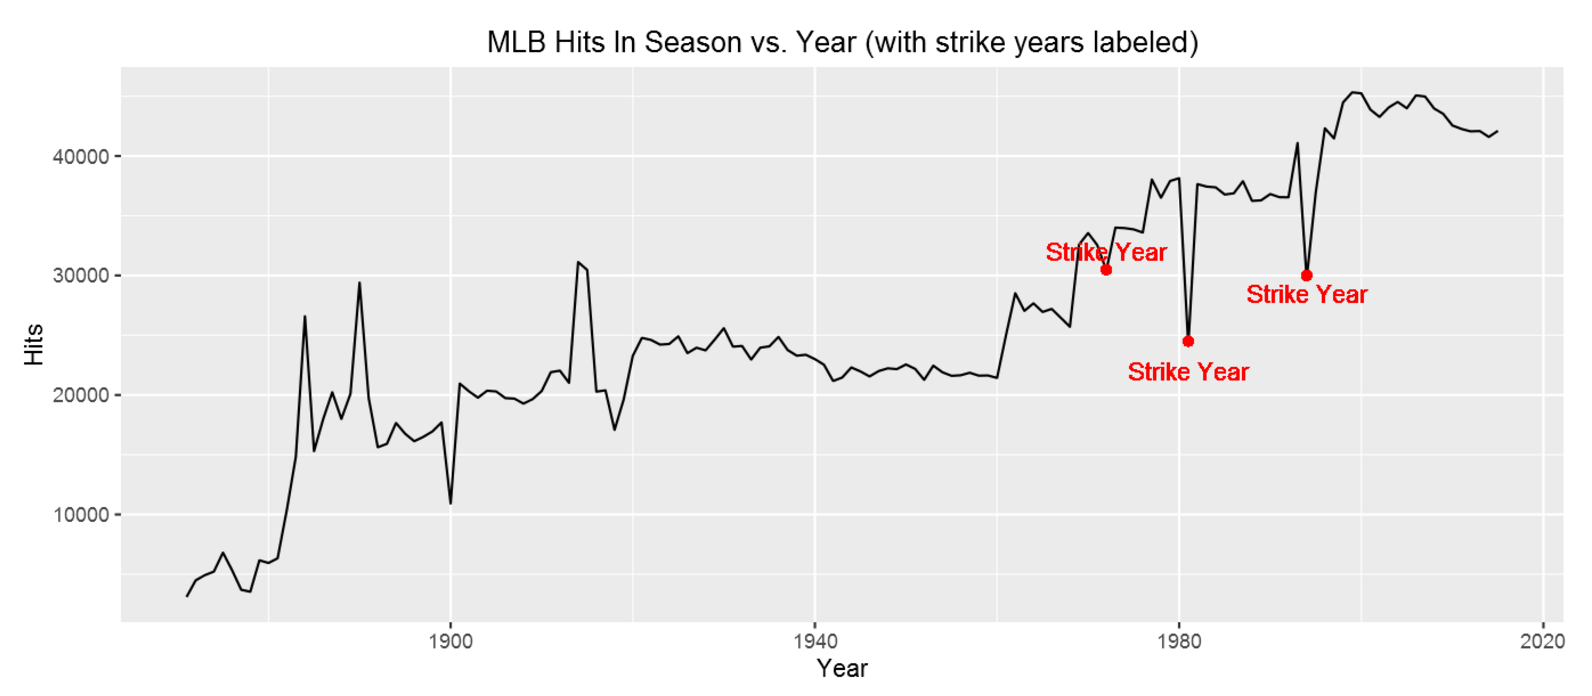
    Baseball Analytics With R
    bartczernicki
    
    2
    View Video
    Hierarchy tree
    boefraty
    
    2
    View Video
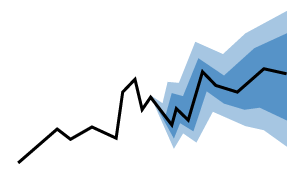
    ARIMA forecasting
    boefraty
    
    10
    View Video
    Time Series Decomposition
    boefraty
    
    3
    View Video
    Forecasting in R Visual / R Custom Visual / Power Query / Line Chart
    boefraty
    
    0
    View Video
    R in Power Query: Clustering
    boefraty
    
    3
    View Video
    Clustering with outliers (DBSCAN)
    boefraty
    
    0
    View Video
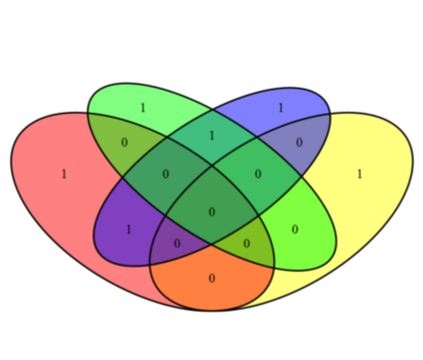
    Venn Diagram
    jessicammoss
    
    6
    View Video
    Map with connecting lines
    ankitpatira
    
    9
    View Video
    Mapping With Labels
    Mike_Carlo
    
    17
    View Video
    MultiChart / Vertical Multiple Charts
    roeibas
    
    5
    View Video
    Power BI demo - Creating Effective Graphs with Microsoft R Open
    mike_honey
    
    13
    View Video
    Bar Chart with Error Bars
    Mike_Carlo
    
    7
    View Video
    HexBin plot
    Mike_Carlo
    
    7
    View Video
    Combined Area - Bar - Scatter Plot
    Mike_Carlo
    
    6
    View Video
    Schedule view
    fathomson
    
    10
    View Video
    Heatmaps
    fathomson
    
    7
    View Video
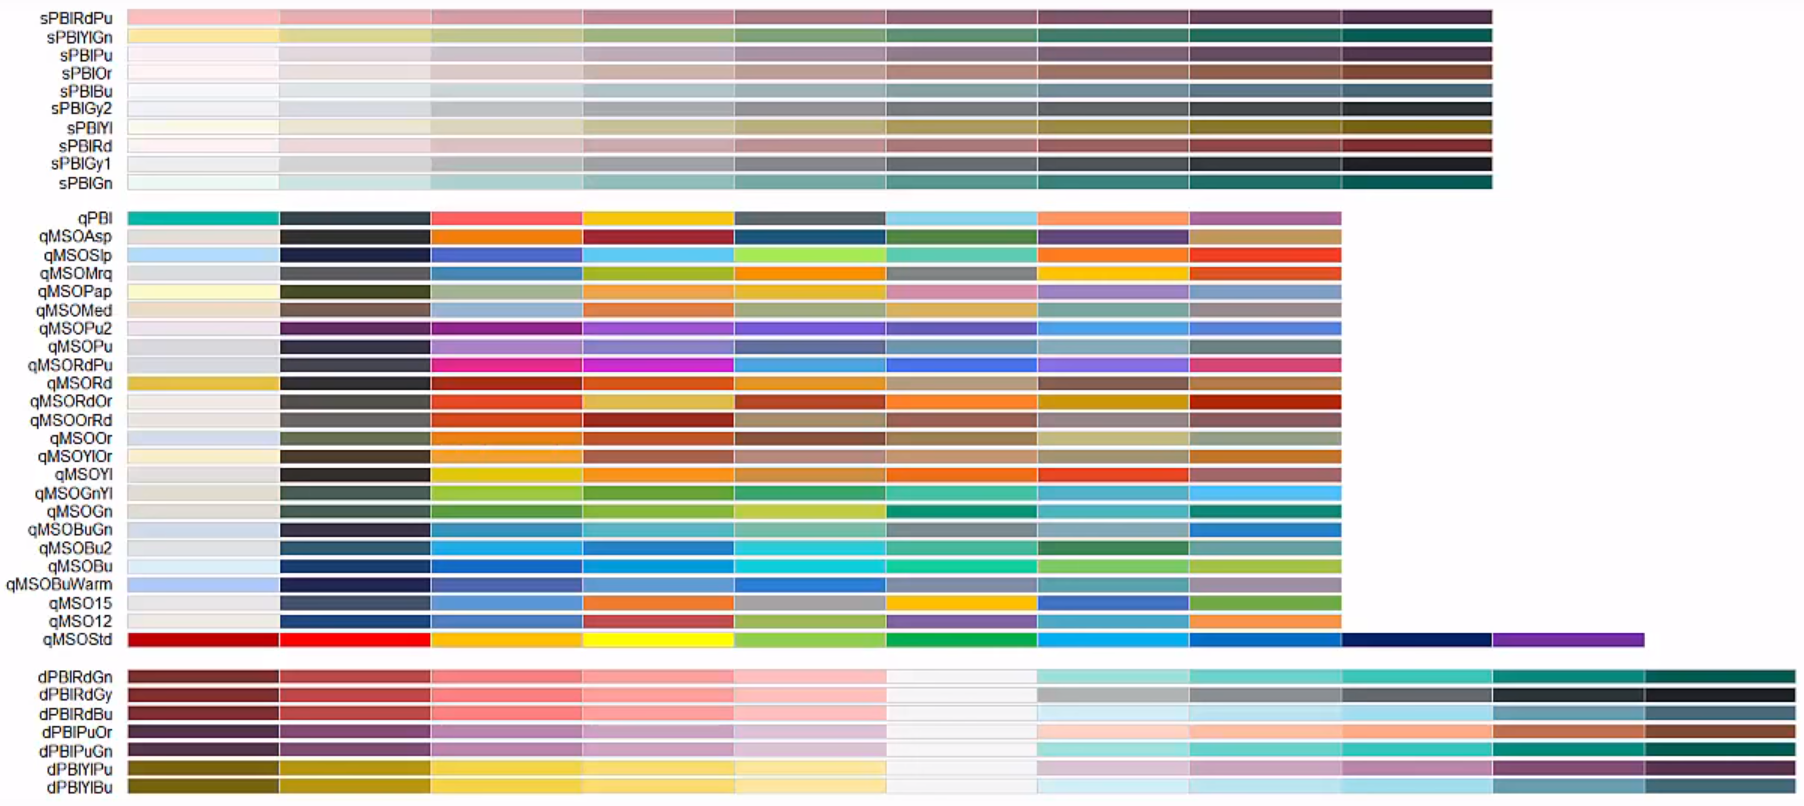
    Redmonder: An R package for those working with Microsoft BI
    pmdci
    
    6
    View Video
    Wordcloud with r
    wbob
    
    9
    View Video
    Data Smoothing with Splines
    Sharon
    
    18
    View Video
    Association Rules
    Sharon
    
    7
    View Video
    Forecasting
    Sharon
    
    15
    View Video
    Clustering
    Sharon
    
    14
    View Video
    Decision Trees
    Sharon
    
    16
    View Video
    Correlation Plot
    Sharon
    
    10
    • « Previous
      • 1
      • 2
    • Next »

    Power Platform

    • Overview
    • Power BI
    • Power Apps
    • Power Pages
    • Power Automate
    • Power Virtual Agents

    • Sign in
    • Sign up

    Browse

    • Solutions
    • Partners
    • Consulting Services

    Downloads

    • Power BI Desktop
    • Power BI Mobile
    • Power BI Report Server
    • See all downloads

    Learn

    • Guided learning
    • Documentation
    • Support
    • Community
    • Give feedback
    • Webinars
    • Developers
    • Blog
    • Newsletter

    © 2023 Microsoft

    Follow Power BI

    • Privacy & cookies
    • Manage cookies
    • Terms of use
    • Trademarks
    Consumer Privacy Act (CCPA) Opt-Out Icon Your Privacy Choices