Get Fabric or SQL Certified for Free.
Get certified for free when you join Fabric Data Days 2026 and dive into Fabric, Power BI, SQL, AI, and other essential data skills.
Join now- Power BI forums
- Get Help with Power BI
- Desktop
- Service
- Report Server
- Power Query
- Mobile Apps
- Developer
- DAX Commands and Tips
- Custom Visuals Development Discussion
- Health and Life Sciences
- Power BI Spanish forums
- Translated Spanish Desktop
- Training and Consulting
- Instructor Led Training
- Dashboard in a Day for Women, by Women
- Galleries
- Data Stories Gallery
- Themes Gallery
- Contests Gallery
- QuickViz Gallery
- Quick Measures Gallery
- Visual Calculations Gallery
- Notebook Gallery
- Translytical Task Flow Gallery
- TMDL Gallery
- R Script Showcase
- Webinars and Video Gallery
- Ideas
- Custom Visuals Ideas (read-only)
- Issues
- Issues
- Events
- Upcoming Events
July 7 - July 17 | Round 2 of the Power BI Dataviz World Championships. Don't miss your chance! Learn more
- Power BI forums
- Galleries
- R Script Showcase
- Hierarchy tree
Your file has been submitted successfully. We’re processing it now - please check back in a few minutes to view your report.
Hierarchy tree
02-09-2017 02:04 AM - last edited 02-09-2017 02:07 AM


- Mark as New
- Bookmark
- Subscribe
- Mute
- Subscribe to RSS Feed
- Permalink
- Report Inappropriate Content
Hierarchy tree
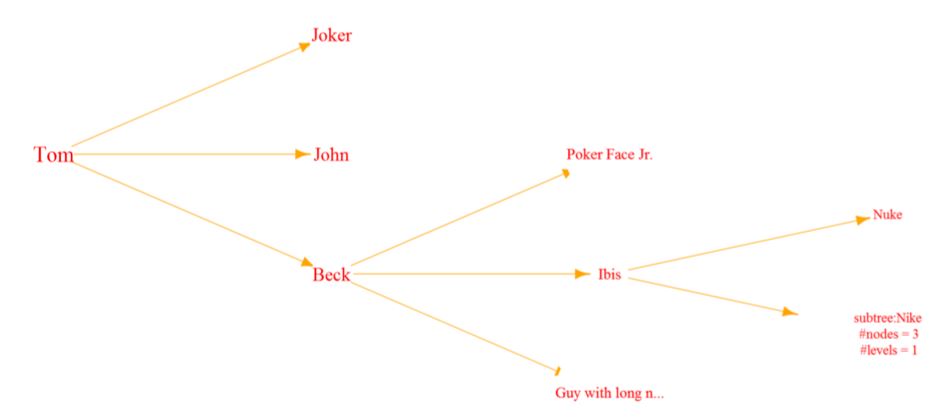
This showcase was requested by one of the users. The attached R script is based on igraph package (supported in service).
Many more wonderful options exist (see here), eventually we hope to support all of them in service.
The provided R code allows you to control basic parameters (maximum levels, sizes, colors, orientation and shape of nodes). The attached PBIX includes several configurations.

