Join us at FabCon Vienna from September 15-18, 2025
The ultimate Fabric, Power BI, SQL, and AI community-led learning event. Save €200 with code FABCOMM.
Get registered- Power BI forums
- Get Help with Power BI
- Desktop
- Service
- Report Server
- Power Query
- Mobile Apps
- Developer
- DAX Commands and Tips
- Custom Visuals Development Discussion
- Health and Life Sciences
- Power BI Spanish forums
- Translated Spanish Desktop
- Training and Consulting
- Instructor Led Training
- Dashboard in a Day for Women, by Women
- Galleries
- Data Stories Gallery
- Themes Gallery
- Contests Gallery
- Quick Measures Gallery
- Notebook Gallery
- Translytical Task Flow Gallery
- TMDL Gallery
- R Script Showcase
- Webinars and Video Gallery
- Ideas
- Custom Visuals Ideas (read-only)
- Issues
- Issues
- Events
- Upcoming Events
Enhance your career with this limited time 50% discount on Fabric and Power BI exams. Ends September 15. Request your voucher.
- Power BI forums
- Galleries
- R Script Showcase
- Hierarchy tree
Hierarchy tree
02-09-2017 02:04 AM - last edited 02-09-2017 02:07 AM


- Mark as New
- Bookmark
- Subscribe
- Mute
- Subscribe to RSS Feed
- Permalink
- Report Inappropriate Content
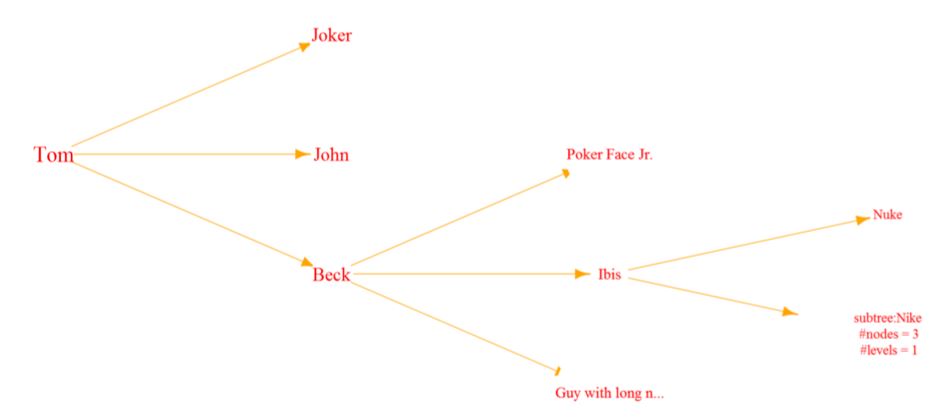
Hierarchy tree
This showcase was requested by one of the users. The attached R script is based on igraph package (supported in service).
Many more wonderful options exist (see here), eventually we hope to support all of them in service.
The provided R code allows you to control basic parameters (maximum levels, sizes, colors, orientation and shape of nodes). The attached PBIX includes several configurations.

