Get Fabric or SQL Certified for Free.
Get certified for free when you join Fabric Data Days 2026 and dive into Fabric, Power BI, SQL, AI, and other essential data skills.
Join now- Power BI forums
- Get Help with Power BI
- Desktop
- Service
- Report Server
- Power Query
- Mobile Apps
- Developer
- DAX Commands and Tips
- Custom Visuals Development Discussion
- Health and Life Sciences
- Power BI Spanish forums
- Translated Spanish Desktop
- Training and Consulting
- Instructor Led Training
- Dashboard in a Day for Women, by Women
- Galleries
- Data Stories Gallery
- Themes Gallery
- Contests Gallery
- QuickViz Gallery
- Quick Measures Gallery
- Visual Calculations Gallery
- Notebook Gallery
- Translytical Task Flow Gallery
- TMDL Gallery
- R Script Showcase
- Webinars and Video Gallery
- Ideas
- Custom Visuals Ideas (read-only)
- Issues
- Issues
- Events
- Upcoming Events
July 7 - July 17 | Round 2 of the Power BI Dataviz World Championships. Don't miss your chance! Learn more
- Power BI forums
- Galleries
- R Script Showcase
- HexBin plot
Your file has been submitted successfully. We’re processing it now - please check back in a few minutes to view your report.
HexBin plot
09-24-2016 05:02 AM - last edited 09-26-2016 19:38 PM


- Mark as New
- Bookmark
- Subscribe
- Mute
- Subscribe to RSS Feed
- Permalink
- Report Inappropriate Content
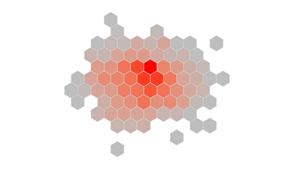
HexBin plot

Description
This plot is for grouping scattered points into hexagonal boxes on a chart. This is useful when l plotting many datapoints and your interested in finding a common pattern among all the x and y points.
Learn It
Want to see exactly how I built this visual? Check out my Hexagonal Bin Tutorial on PowerBI.Tips which explains how to create this visual step by step. Tutorial includes detailed explainations about the R script. Enjoy!
Prerequisites (The sample .pbix files won't work without installing the following)
1. Install R Engine
Power BI does not include the R engine. Therefore, a seperate installation is required to install R on your local computer. You can download R from the Revolution Open download page, and through the CRAN Repository.
2. Install the R packages
Once R engine has been installed you can dowload the package from the Revolution Open Package Downloads Page.
Required R Packages
ggplot2
hexbin
Tested on
MRO 3.3.1, CRAN 3.3.1