Get Fabric or SQL Certified for Free.
Get certified for free when you join Fabric Data Days 2026 and dive into Fabric, Power BI, SQL, AI, and other essential data skills.
Join now- Power BI forums
- Get Help with Power BI
- Desktop
- Service
- Report Server
- Power Query
- Mobile Apps
- Developer
- DAX Commands and Tips
- Custom Visuals Development Discussion
- Health and Life Sciences
- Power BI Spanish forums
- Translated Spanish Desktop
- Training and Consulting
- Instructor Led Training
- Dashboard in a Day for Women, by Women
- Galleries
- Data Stories Gallery
- Themes Gallery
- Contests Gallery
- QuickViz Gallery
- Quick Measures Gallery
- Visual Calculations Gallery
- Notebook Gallery
- Translytical Task Flow Gallery
- TMDL Gallery
- R Script Showcase
- Webinars and Video Gallery
- Ideas
- Custom Visuals Ideas (read-only)
- Issues
- Issues
- Events
- Upcoming Events
July 7 - July 17 | Round 2 of the Power BI Dataviz World Championships. Don't miss your chance! Learn more
- Power BI forums
- Galleries
- R Script Showcase
- Heatmaps
Your file has been submitted successfully. We’re processing it now - please check back in a few minutes to view your report.


- Mark as New
- Bookmark
- Subscribe
- Mute
- Subscribe to RSS Feed
- Permalink
- Report Inappropriate Content
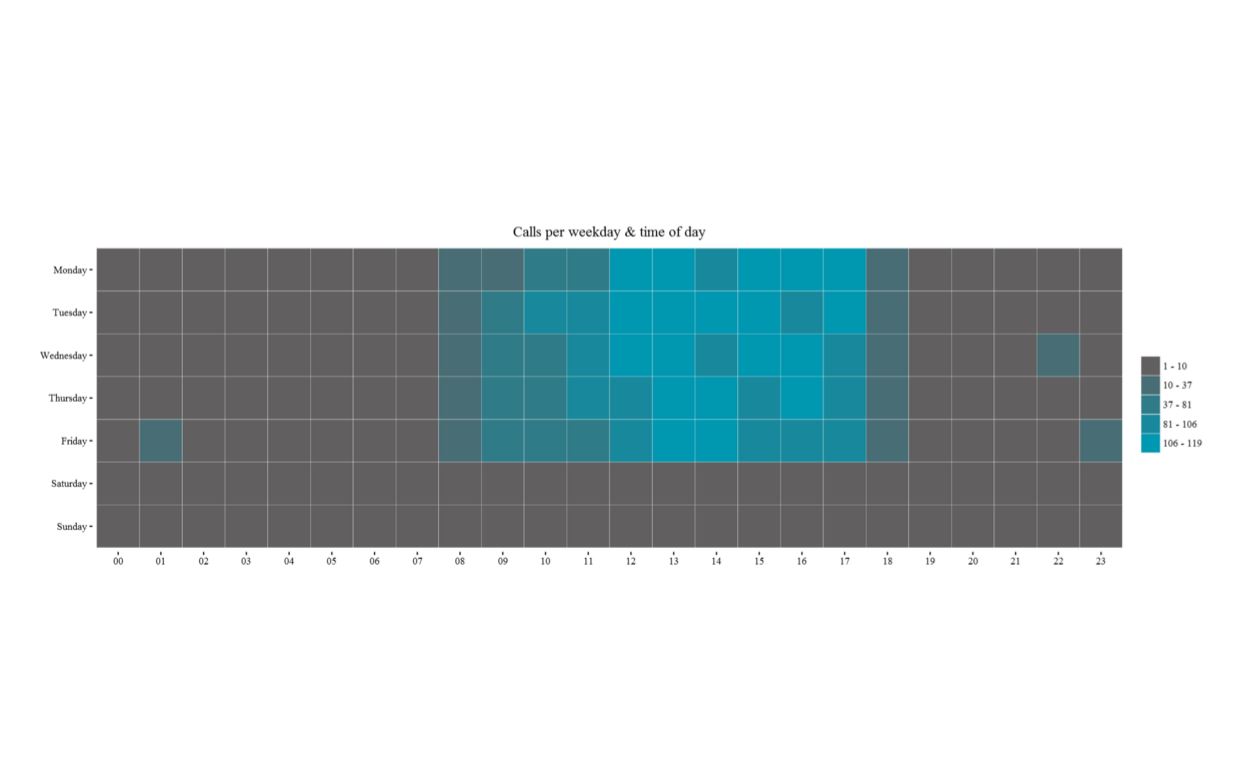
Heatmaps

Description
Prerequisites (The sample .pbix files will not work without these prerequites completed)
1. Install R Engine
Power BI Desktop does not include, deploy or install the R engine. To run R scripts in Power BI Desktop, you must separately installR on your local computer. You can download and install R for free from many locations, including the Revolution Open download page, and the CRAN Repository.
2. Install the required R packages.
Download the R script attached to this message and run it to install all required packages on your local machine.
Required R packages:
dplyr, ggplot2, ggthemes, zoo
Tested on:
CRAN 3.3.1, MRO 3.3.0, powerbi.com
- Mark as New
- Bookmark
- Subscribe
- Mute
- Subscribe to RSS Feed
- Permalink
- Report Inappropriate Content
@Anonymous Looks nice and thanks for adding the R installation script!
@vrocca Thanks! In R studio I usually use the install.packages('packagename') to add a new package. And above your script or markdown document library('packagename')
- Mark as New
- Bookmark
- Subscribe
- Mute
- Subscribe to RSS Feed
- Permalink
- Report Inappropriate Content
Hi @fathomson,
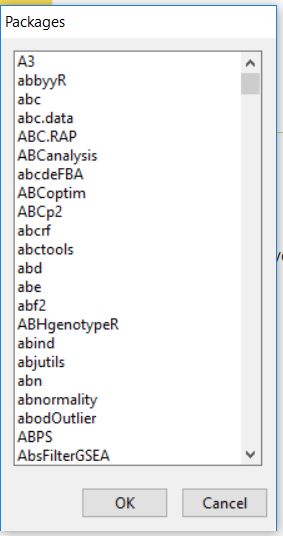
I'm new to R and just installed Microsoft R Open onto my laptop. I have also downloaded the rscript. However, when I click on Packages->Install Packages....this appears ( see attached).
I think I'm perhaps doing it wrong. Ultimately, I need the 2 dimension heat map to be on powerbi so that I can use it on my data. I'm a bit confused as to how to go about this so would be great if you could list down a step by step guide to this.
Thanks,
Lina
- Mark as New
- Bookmark
- Subscribe
- Mute
- Subscribe to RSS Feed
- Permalink
- Report Inappropriate Content
Hi @fathomson,
I'm new to R and just installed Microsoft R Open onto my laptop. I have also downloaded the rscript. However, when I click on Packages->Install Packages....this appears ( see attached).
I think I'm perhaps doing it wrong. Ultimately, I need the 2 dimension heat map to be on powerbi so that I can use it on my data. I'm a bit confused as to how to go about this so would be great if you could list down a step by step guide to this.
Thanks,
Lina
- Mark as New
- Bookmark
- Subscribe
- Mute
- Subscribe to RSS Feed
- Permalink
- Report Inappropriate Content
Is there any way we could change this from a count per hour / day. To an average count per hour / day?
- Mark as New
- Bookmark
- Subscribe
- Mute
- Subscribe to RSS Feed
- Permalink
- Report Inappropriate Content
I wish I'd seen this posting before I started my example...![]()
My version uses the same ggplot and geom_tile functions as @fathomson but, rather than use R to massage the data with dplyr etc., it links directly to fields dragged from PBI - a typical Date dimension column and uses a calculated Time Bucket column as the other dimension against which to map the Call Count measure. I DO use the 'complete' function from the 'tidyr' package to fill in missing values and avoid holes in the heatmap.
I also played with presenting the value of the measure on the tile and some other formatting options. I tried to use the viridis palette package, but it's not supported on PBI Service yet.
Required R packages: ggplot2, ggthemes, tidyr. (see attached R script)

- Mark as New
- Bookmark
- Subscribe
- Mute
- Subscribe to RSS Feed
- Permalink
- Report Inappropriate Content
Here are the links to download the packages referenced:
dplyr: https://cran.r-project.org/src/contrib/dplyr_0.5.0.tar.gz
ggplot2: https://cran.r-project.org/src/contrib/ggplot2_2.1.0.tar.gz
ggthemes: https://cran.fhcrc.org/src/contrib/ggthemes_3.2.0.tar.gz
zoo: https://cran.r-project.org/src/contrib/zoo_1.7-13.tar.gz
Alternatively, you can install these throug R Studio by clicking on Packages > Install and entering the name of the package.
Hope that helps.
Victor Rocca | www.victorrocca.com
- Mark as New
- Bookmark
- Subscribe
- Mute
- Subscribe to RSS Feed
- Permalink
- Report Inappropriate Content
There doesnt appear to be any R script attached to this topic?