This is best Fabric, Power BI, SQL and AI community event. How do we know? The last event sold out! Save €200 with code FABCMTY200.
Register nowA new Data Days event is coming soon! This time we’re going bigger than ever. Fabric, Power BI, SQL, AI and more. Don't miss out.
Hi all,
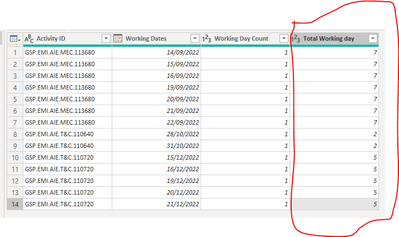
I have the below table in Power BI Power query.
I wanted to simplify the subject and paste the Excel copy of it instead.
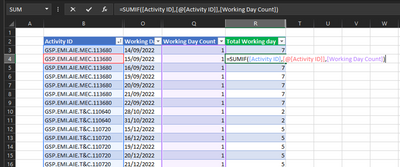
The columns with blue titles are my available data. I want to generate the Green column in Power query.
It's so simple in excel. As shown below.
How can I do the same operation in Power BI? I would like to return each sumif figure on each row.
Ultimately, my goal is to add a new column and generate a calculated copy of the highligted column in PBI power query.
Thank you.
Solved! Go to Solution.
It does not appear that you are in the Query Editor (Power Query).
Select `Home=>Transform`
Then you will find the GroupBy option and, when the dialog box opens, select Advanced to be able to add multiple aggregations/operations
Hi @ronrsnfld,
Thanks for the response.
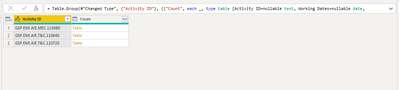
I grouped the data by the Activity ID.
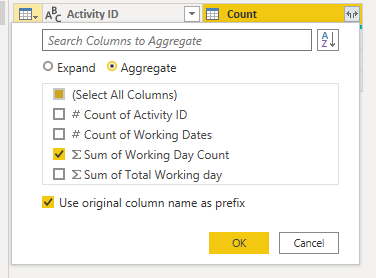
I aggregated all with sum of working day count. However, I couldn't see anything regarding "all rows"
The end result is this. I can't aggregate or select All Rows.
It does not appear that you are in the Query Editor (Power Query).
Select `Home=>Transform`
Then you will find the GroupBy option and, when the dialog box opens, select Advanced to be able to add multiple aggregations/operations
Thank you! It is resolved. You were extremely fast 😄
This forum is lucky to have someone like you.
Check out the May 2026 Power BI update to learn about new features.
Sign up to receive a private message when registration opens and key events begin.
If you have recently started exploring Fabric, we'd love to hear how it's going. Your feedback can help with product improvements.
| User | Count |
|---|---|
| 7 | |
| 6 | |
| 6 | |
| 6 | |
| 4 |