Get certified for free when you join Fabric Data Days 2026 and dive into Fabric, Power BI, SQL, AI, and other essential data skills.
Join nowJuly 28 - August 9 | Final Round of the Power BI Dataviz World Championships. This is your chance. Learn more
Hello experts there,
I have some issues when visualize this.
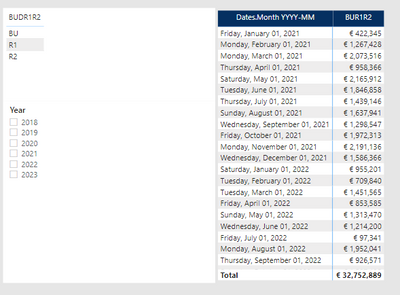
I have 1 monthly Budget table, with 3 versions: BU, R1 and R2.
For 2021 table contains only R1 & R2, no BU
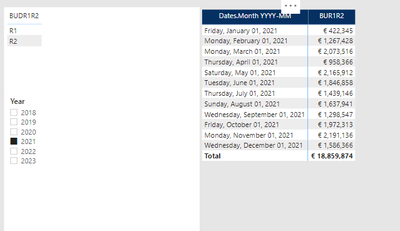
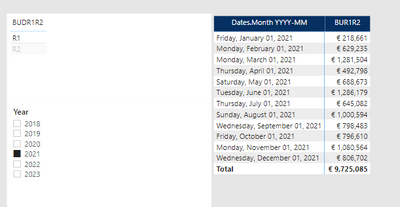
For 2021, I only have R1 and R2, it visual correctly when i filter verion
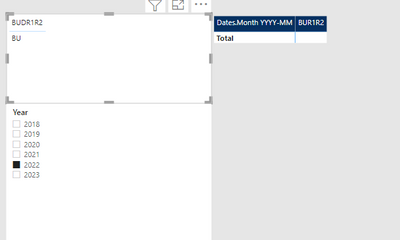
I have problem with 2022.
For 2022, table only contains BU, no R1 or R2 yet.
I cant understand this. Do you have any idea? how can i display 2022 BU in this case?
thanks for you advises
Hi @Anonymous ,
Can you share the calculation that is populating your [BUR1R2] column please?
Pete
Proud to be a Datanaut!
Hi @Anonymous,
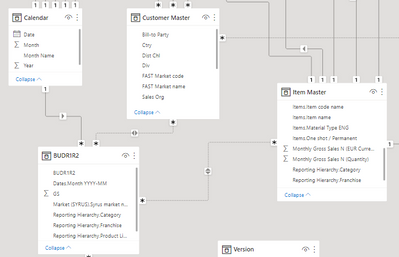
Which key column do you use to connect table "BUDR1R2" and Calendar?
Best Regards,
Kelly
Did I answer your question? Mark my reply as a solution!
Hi Kelly,
it is Date column & date.month YYYY-DD, both date format.
Hi @Anonymous ,
Can you create a simple sample for test?
Best Regards,
Kelly
Did I answer your question? Mark my reply as a solution!
If you love stickers, then you will definitely want to check out our community sticker challenge, Barcelona edition!
Check out the July 2026 Power BI update to learn about new features.