This is best Fabric, Power BI, SQL and AI community event. How do we know? The last event sold out! Save €200 with code FABCMTY200.
Register nowThe Fabric community is upgrading! Read all of the details including the timeline and what you can expect. Learn more
Hello Community,
I am trying to create a calculated column to deliver a rank. I have a table of data the looks something like this...
| Test ID | Run ID |
1 | 5 |
| 1 | 8 |
| 1 | 3 |
| 2 | 6 |
| 2 | 3 |
| 2 | 1 |
| 3 | 1 |
| 3 | 5 |
| 3 | 9 |
And Im looking to rank the Run ID from highest value to lowest for each Test ID, the expected table would show...
| Test ID | Run ID | Rank |
1 | 5 | 2 |
| 1 | 8 | 3 |
| 1 | 3 | 1 |
| 2 | 6 | 3 |
| 2 | 3 | 2 |
| 2 | 1 | 1 |
| 3 | 1 | 1 |
| 3 | 5 | 2 |
| 3 | 9 | 3 |
Any help from the community is much apperciated!!
Solved! Go to Solution.
Hi,
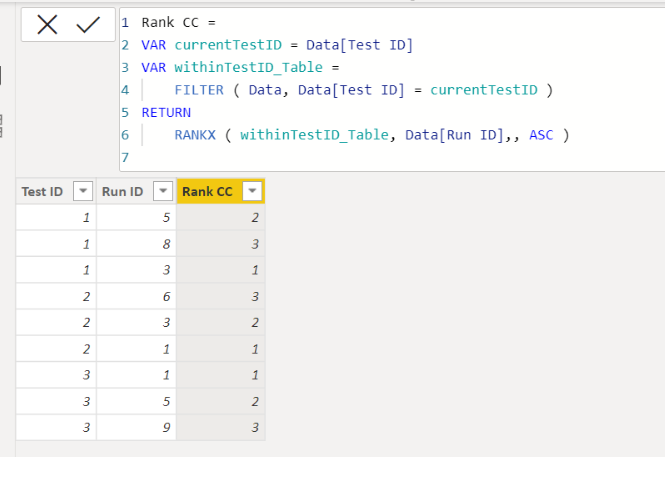
Please check the below picture and the attached pbix file.
It is for creating a new column.
Rank CC =
VAR currentTestID = Data[Test ID]
VAR withinTestID_Table =
FILTER ( Data, Data[Test ID] = currentTestID )
RETURN
RANKX ( withinTestID_Table, Data[Run ID],, ASC )
Thanks for the help! Both solutions work as expected.
Hi,
Please check the below picture and the attached pbix file.
It is for creating a new column.
Rank CC =
VAR currentTestID = Data[Test ID]
VAR withinTestID_Table =
FILTER ( Data, Data[Test ID] = currentTestID )
RETURN
RANKX ( withinTestID_Table, Data[Run ID],, ASC )
Join us in Barcelona for FabCon and SQLCon, the Fabric, Power BI, SQL, and AI community event. Save €200 with code FABCMTY200.
| User | Count |
|---|---|
| 24 | |
| 22 | |
| 20 | |
| 18 | |
| 14 |
| User | Count |
|---|---|
| 29 | |
| 22 | |
| 22 | |
| 20 | |
| 20 |