This is best Fabric, Power BI, SQL and AI community event. How do we know? The last event sold out! Save €200 with code FABCMTY200.
Register nowThe Fabric community is upgrading! Read all of the details including the timeline and what you can expect. Learn more
Hello, i need help with the multirow card.
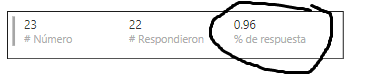
1. i need to show the 0.96 in percentage an not in regular number, in the querie is already in %
2. also is there a way in different row like the percentage in a first row and on the 2nd row the other number?
thank you for help
Solved! Go to Solution.
HI @anaorca1990,
It is hard to control which column will display as group title. Based on test, it seems like power bi will auto analysis these columns and choose one of them to display as group title.
I'd like to suggest you use matrix to instead, it can summary records by row label.(you can drag columns to row field as category column)
BTW, measures are impossible to use as category label.
Regards,
Xiaoxin Sheng
HI @anaorca1990,
#1.
It seems like power bi can't recognize original formula from your database, please click on your column and manually format it at format tab.
BTW, if you connected data source with live connection mode, please try to create a measure to format specific column.
#2.
Do you mean compare current row with another row? If this is a case, you need to write a formula to compare them, power bi not contains features to compare different rows.
Regards,
Xiaoxin Sheng
Hello @Anonymous
1. i alredy try to manually format it column but is doesnt not allow me, also about the measure shoud it be like a new column? sorry im new in power bi
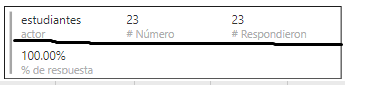
2. maybe this will help to clarify what i want to do, when i use the multirow card it looks like this
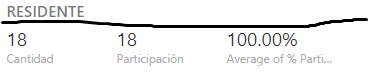
and i want it look like this
is the same information i just want it to display it differently. thank you
HI @anaorca1990,
It is hard to control which column will display as group title. Based on test, it seems like power bi will auto analysis these columns and choose one of them to display as group title.
I'd like to suggest you use matrix to instead, it can summary records by row label.(you can drag columns to row field as category column)
BTW, measures are impossible to use as category label.
Regards,
Xiaoxin Sheng
Join us in Barcelona for FabCon and SQLCon, the Fabric, Power BI, SQL, and AI community event. Save €200 with code FABCMTY200.
| User | Count |
|---|---|
| 13 | |
| 11 | |
| 9 | |
| 6 | |
| 5 |