Get certified for free when you join Fabric Data Days 2026 and dive into Fabric, Power BI, SQL, AI, and other essential data skills.
Join nowJuly 7 - July 17 | Round 2 of the Power BI Dataviz World Championships. Don't miss your chance! Learn more
Hello!
I've been used the heat map tool from Power BI and the zoom function do not keep when we change some filter on the region that we are analysing, so that we have to aply the zoom again. Can somebody help me with this? Or the community could get this as a suggestion, please...best regards, thank you!
Solved! Go to Solution.
Hi @amanda_gdf
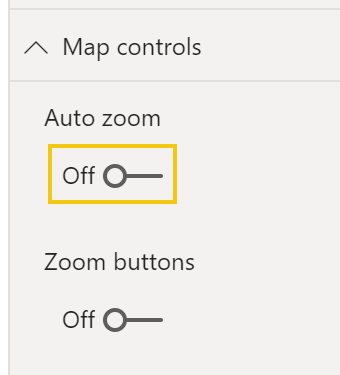
If you are using the "heat map" facility on the standard Power BI map, by default the map auto-zooms to show all datapoints each time you change filter context. It's quite easy to change this and "fix" the zoom level. On the map visualisation in the controls, go to "Map Controls" and turn AutoZoom off.
This will stop the map automatically moving or "zooming" each time you change filter context.
Hope this helps
Stuart
Hi @amanda_gdf
If you are using the "heat map" facility on the standard Power BI map, by default the map auto-zooms to show all datapoints each time you change filter context. It's quite easy to change this and "fix" the zoom level. On the map visualisation in the controls, go to "Map Controls" and turn AutoZoom off.
This will stop the map automatically moving or "zooming" each time you change filter context.
Hope this helps
Stuart
it worked, Stuart, thanks!!
Join us in Barcelona for FabCon and SQLCon, the Fabric, Power BI, SQL, and AI community event. Save €200 with code FABCMTY200.
Join Data Days 2026: 60 days of free live/on-demand sessions, challenges, study groups, and certification opportunities.
| User | Count |
|---|---|
| 23 | |
| 12 | |
| 10 | |
| 10 | |
| 4 |
| User | Count |
|---|---|
| 32 | |
| 31 | |
| 27 | |
| 26 | |
| 22 |