cancel
Showing results for 
Search instead for 
Did you mean: 

July 7 - July 17 | Round 2 of the Power BI Dataviz World Championships. Don't miss your chance! Learn more

Reply
Anonymous
Not applicable

Matrix

I have a table:


1/31/2019 --- 5.00  --- Washington

1/31/2019 --- 6.00 --- California

1/31/2019 --- 7.00 --- Oregon

1/31/2019 --- 10.00 --- Mexico

3/31/2019 --- 6.00  --- Washington

3/31/2019 --- 7.00 --- California

3/31/2019 --- 8.00 --- Oregon

3/31/2019 --- 9.00 --- Mexico

12/31/2019 --- 8.00  --- Washington

12/31/2019 --- 9.00 --- California

12/31/2019 --- 10.00 --- Oregon

12/31/2019 --- 11.00 --- Mexico


And i am trying to get the variance (YearEnd-MonthEnd) and show it in a matrix.  Would you be able to assist?


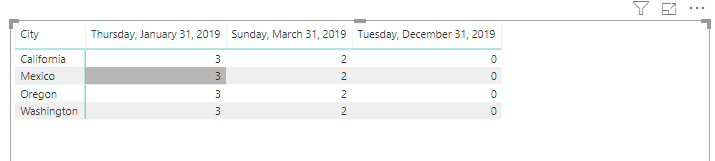
Here is how it should look like:

                                     1/31/2019               12/31/2019

Washington                      3                                 0

California                          3                                 0

Oregon                             3                                 0

Mexico                             3                                  0


I created a new query and tried to merge and append the 2 queries but the matrix ends up summarizing the yearend data which is not correct.   Thank you for your help.

3 ACCEPTED SOLUTIONS
v-frfei-msft
Community Support
Community Support

Hi @Anonymous ,


To create a measure as below.


Measure 2 = 
CALCULATE (
    SUM ( 'Table'[time] ),
    FILTER ( ALL ( 'Table' ), 'Table'[date] = ENDOFYEAR ( 'Table'[date] ) ),
    VALUES ( 'Table'[City] )
)
    - CALCULATE ( SUM ( 'Table'[time] ) )

Capture.PNG

Community Support Team _ Frank
If this post helps, then please consider Accept it as the solution to help the others find it more quickly.

View solution in original post

Anonymous
Not applicable

Hi 


View solution in original post

Anonymous
Not applicable

Hi  


SUM(GoalVariance[ShareBalance])/CALCULATE( SUM (GoalVariance[GoalValue]), FILTER (ALL (GoalVariance), GoalVariance[MonthEndDate] = ENDOFYEAR (GoalVariance[MonthEndDate])), VALUES (GoalVariance[AcctBranchName]))
 
I cannot thank you enough.  This is the last piece i am working on before taking a 3 week vacation on the 4th!!!  Thank you thank you thank you again
 
Glen

View solution in original post

3 REPLIES 3
v-frfei-msft
Community Support
Community Support

Hi @Anonymous ,


To create a measure as below.


Measure 2 = 
CALCULATE (
    SUM ( 'Table'[time] ),
    FILTER ( ALL ( 'Table' ), 'Table'[date] = ENDOFYEAR ( 'Table'[date] ) ),
    VALUES ( 'Table'[City] )
)
    - CALCULATE ( SUM ( 'Table'[time] ) )

Capture.PNG

Community Support Team _ Frank
If this post helps, then please consider Accept it as the solution to help the others find it more quickly.
Anonymous
Not applicable

Hi  


SUM(GoalVariance[ShareBalance])/CALCULATE( SUM (GoalVariance[GoalValue]), FILTER (ALL (GoalVariance), GoalVariance[MonthEndDate] = ENDOFYEAR (GoalVariance[MonthEndDate])), VALUES (GoalVariance[AcctBranchName]))
 
I cannot thank you enough.  This is the last piece i am working on before taking a 3 week vacation on the 4th!!!  Thank you thank you thank you again
 
Glen
Anonymous
Not applicable

Hi 


Helpful resources

Announcements
FabCon and SQLCon Barcelona 2026

FabCon & SQLCon – Barcelona 2026

Join us in Barcelona for FabCon and SQLCon, the Fabric, Power BI, SQL, and AI community event. Save €200 with code FABCMTY200.

60 days of Data Days Carousel

Data Days 2026

Join Data Days 2026: 60 days of free live/on-demand sessions, challenges, study groups, and certification opportunities.

Power BI DataViz World Championships carousel

Power BI DataViz World Championships - June 2026

A new Power BI DataViz World Championship is coming this June! Don't miss out on submitting your entry.

Top Solution Authors