Get certified for free when you join Fabric Data Days 2026 and dive into Fabric, Power BI, SQL, AI, and other essential data skills.
Join nowJuly 28 - August 9 | Final Round of the Power BI Dataviz World Championships. This is your chance. Learn more
Hello Everybody
if i have the tab a and tab b and i want ot create a table c like below, how i have to do?
| tab a | tab b | tab c | |||||||||
| A | B | C | A | B | F | A | B | C | F | ||
| X | 1 | a | X | 4 | b | X | 5 | a | b | ||
| Y | 2 | b | Y | 5 | c | Y | 7 | b | c | ||
| Z | 3 | c | Z | 6 | f | Z | 9 | c | f | ||
| T | 8 | h | T | 8 | h | ||||||
| G | 9 | j | G | 9 | j |
Solved! Go to Solution.
Go to table A @Anonymous
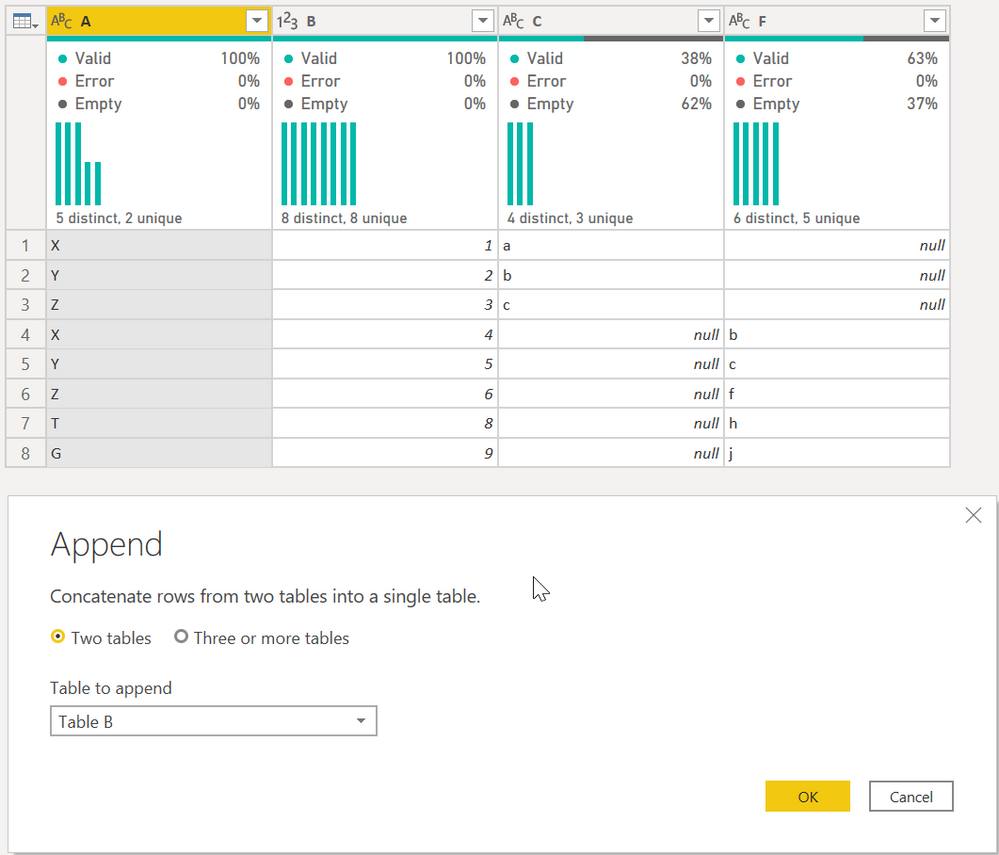
First, select Append Queries as shown. It will give you this table:
Then select column A and then Group By on the ribbon. Select the Advanced button, and do the following:
That is a very specific sequence that only works when data looks like that. I am not sure how adaptable that will be to a much larger and more complex data set.
DAX is for Analysis. Power Query is for Data Modeling
Proud to be a Super User!
MCSA: BI ReportingHi, @Anonymous
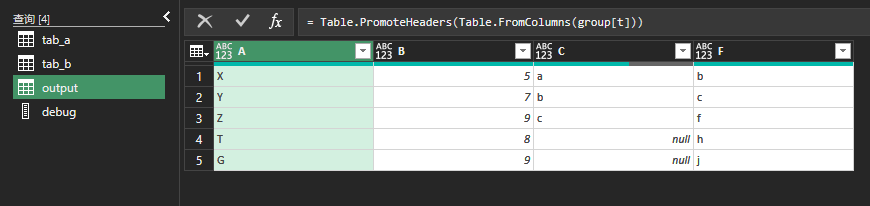
Try this:
// tab_a
let
Source = Excel.CurrentWorkbook(){[Name="tab_a"]}[Content],
trsp = Table.Transpose(Table.DemoteHeaders(Source))
in
trsp
// tab_b
let
Source = Excel.CurrentWorkbook(){[Name="tab_b"]}[Content],
trsp = Table.Transpose(Table.DemoteHeaders(Source))
in
trsp
// output
let
Source = Table.Combine({tab_a, tab_b}),
fx = (tbl)=>
let
lists = Table.ToList(tbl, each List.Skip(_)),
fnChkIsNum = (lists)=>
List.AllTrue(
List.Transform(
lists,
(slist)=>List.AllTrue(List.Transform(slist, each Value.Is(_??1, type number)))
)
),
ChkIsNum = fnChkIsNum(lists),
trans = if ChkIsNum = true then List.Transform(List.Zip(lists), List.Sum)
else List.Transform(List.Zip(lists), each List.Distinct(List.RemoveNulls(_)){0}?)
in trans,
group = Table.Group(Source,"Column1",{"t", each {[Column1]{0}}&fx(_)}),
result = Table.PromoteHeaders(Table.FromColumns(group[t]))
in
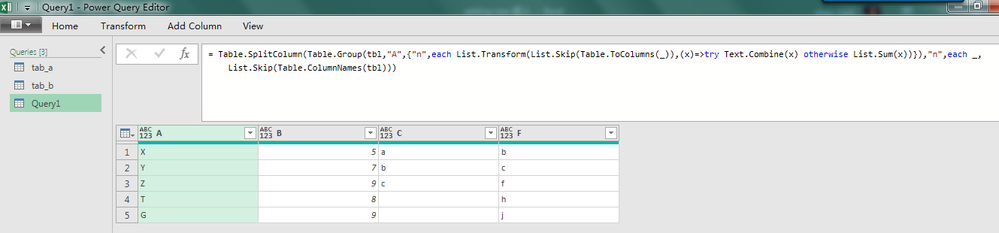
resultUpload two tables into Power Query Editor, and paste below code in a blank query.
let
tbl = tab_a&tab_b,
Source = Table.SplitColumn(Table.Group(tbl,"A",{"n",each List.Transform(List.Skip(Table.ToColumns(_)),(x)=>try Text.Combine(x) otherwise List.Sum(x))}),"n",each _,List.Skip(Table.ColumnNames(tbl)))
in
Source
Upload two tables into Power Query Editor, and paste below code in a blank query.
let
tbl = tab_a&tab_b,
Source = Table.SplitColumn(Table.Group(tbl,"A",{"n",each List.Transform(List.Skip(Table.ToColumns(_)),(x)=>try Text.Combine(x) otherwise List.Sum(x))}),"n",each _,List.Skip(Table.ColumnNames(tbl)))
in
Source
Hi, @Anonymous
Try this:
// tab_a
let
Source = Excel.CurrentWorkbook(){[Name="tab_a"]}[Content],
trsp = Table.Transpose(Table.DemoteHeaders(Source))
in
trsp
// tab_b
let
Source = Excel.CurrentWorkbook(){[Name="tab_b"]}[Content],
trsp = Table.Transpose(Table.DemoteHeaders(Source))
in
trsp
// output
let
Source = Table.Combine({tab_a, tab_b}),
fx = (tbl)=>
let
lists = Table.ToList(tbl, each List.Skip(_)),
fnChkIsNum = (lists)=>
List.AllTrue(
List.Transform(
lists,
(slist)=>List.AllTrue(List.Transform(slist, each Value.Is(_??1, type number)))
)
),
ChkIsNum = fnChkIsNum(lists),
trans = if ChkIsNum = true then List.Transform(List.Zip(lists), List.Sum)
else List.Transform(List.Zip(lists), each List.Distinct(List.RemoveNulls(_)){0}?)
in trans,
group = Table.Group(Source,"Column1",{"t", each {[Column1]{0}}&fx(_)}),
result = Table.PromoteHeaders(Table.FromColumns(group[t]))
in
resultGo to table A @Anonymous
First, select Append Queries as shown. It will give you this table:
Then select column A and then Group By on the ribbon. Select the Advanced button, and do the following:
That is a very specific sequence that only works when data looks like that. I am not sure how adaptable that will be to a much larger and more complex data set.
DAX is for Analysis. Power Query is for Data Modeling
Proud to be a Super User!
MCSA: BI ReportingIf you love stickers, then you will definitely want to check out our community sticker challenge, Barcelona edition!
Check out the July 2026 Power BI update to learn about new features.
| User | Count |
|---|---|
| 4 | |
| 2 | |
| 2 | |
| 2 | |
| 1 |