Get certified for free when you join Fabric Data Days 2026 and dive into Fabric, Power BI, SQL, AI, and other essential data skills.
Join nowJuly 28 - August 9 | Final Round of the Power BI Dataviz World Championships. This is your chance. Learn more
Tablemeasure = Union( selectcolumns(Table A,"Opening_Date", Table A[Opening_Date]), selectcolumns(Table B,"Business_Date", Table B[Business_Date]), )
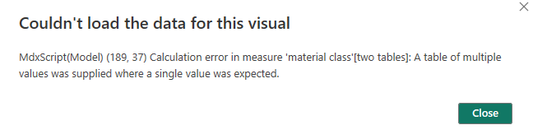
I created a measure using this format above but when I try to put it into a visual I get the error below. Anyone have an idea of what I might be doing wrong?
Solved! Go to Solution.
If you need a list of dates for a visual, create a calculated table instead of a measure :
CombinedDatesTable = UNION(
SELECTCOLUMNS(TableA, "Date", TableA[Opening_Date]),
SELECTCOLUMNS(TableB, "Date", TableB[Business_Date])
)then for the measure :
UniqueDateCount = DISTINCTCOUNT(UNION(SELECTCOLUMNS(TableA, "Date", TableA[Opening_Date]), SELECTCOLUMNS(TableB, "Date", TableB[Business_Date])))
If you need a list of dates for a visual, create a calculated table instead of a measure :
CombinedDatesTable = UNION(
SELECTCOLUMNS(TableA, "Date", TableA[Opening_Date]),
SELECTCOLUMNS(TableB, "Date", TableB[Business_Date])
)then for the measure :
UniqueDateCount = DISTINCTCOUNT(UNION(SELECTCOLUMNS(TableA, "Date", TableA[Opening_Date]), SELECTCOLUMNS(TableB, "Date", TableB[Business_Date])))
This is what I created but I'm only getting the Material column in the resulting table?
Can you please share your pbix file ?
Your solution worked, I just had to tweek it a bit for my situation. I accepted your solution.
If you love stickers, then you will definitely want to check out our community sticker challenge, Barcelona edition!
Check out the July 2026 Power BI update to learn about new features.
| User | Count |
|---|---|
| 28 | |
| 28 | |
| 19 | |
| 19 | |
| 19 |
| User | Count |
|---|---|
| 37 | |
| 29 | |
| 18 | |
| 17 | |
| 15 |