This is best Fabric, Power BI, SQL and AI community event. How do we know? The last event sold out! Save €200 with code FABCMTY200.
Register nowA new Data Days event is coming soon! This time we’re going bigger than ever. Fabric, Power BI, SQL, AI and more. Don't miss out.
Hi PBI gurus,
I have one table of data called Table with two columns "Product" and "Volume". I have performed top 5 Rankx calculation which works fine. I now want to countrows based on Rankx result and return either top 5 or top 4 depending on the number of results from Top5 Measure. For example the Top5 measure result returns 9 results, I want to put a condition if it returns <=5 results I want to return Top5 measure, if not I want return Top4 so <=4.
I believe this would need a countrows added to the Rankx calculation but struggling to combine the two.
Top 5 Measure;
| Product | Top5 |
| J | 1 |
| N | 2 |
| G | 3 |
| I | 3 |
| E | 4 |
| A | 5 |
| B | 5 |
| K | 5 |
| M | 5 |
Result wanted as Top 5 return 9 results (revert to top4)
| Product | Top5 |
| J | 1 |
| N | 2 |
| G | 3 |
| I | 3 |
| E | 4 |
Data Table
|
Solved! Go to Solution.
you can try this
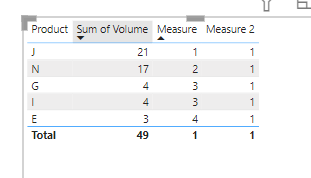
Measure 2 =
VAR _tbl=SUMMARIZE(ALL('Table'),'Table'[Product],"value",sum('Table'[Volume]))
VAR _tbl2=ADDCOLUMNS(_tbl,"rank",rankx(_tbl,[value],,DESC,Dense))
VAR _count=COUNTROWS(FILTER(_tbl2,[rank]<=5))
return If(_count>5,IF([Measure]<5,1))
and add measure 2 to filter
pls see the attachment below
Proud to be a Super User!
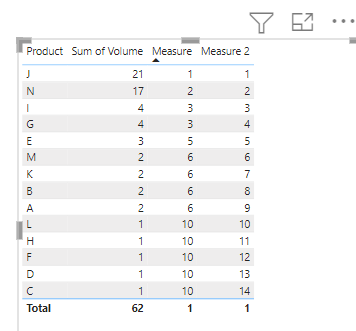
here is a workaround for you
Measure = rankx(all('Table'[Product]),CALCULATE(sum('Table'[Volume])),,DESC)+rankx(all('Table'[Product]),CALCULATE(max('Table'[Product])),,DESC)/100
Measure 2 = rankx(all('Table'[Product]),[Measure],,ASC)
Proud to be a Super User!
Thanks for your reply. Based on my requirements I'm not after a tie break splitter, but rather logic if top 5 results in more than 5 results revert to top 4. Only way I could see to do this is by countrows logic on the Rankx
you can try this
Measure 2 =
VAR _tbl=SUMMARIZE(ALL('Table'),'Table'[Product],"value",sum('Table'[Volume]))
VAR _tbl2=ADDCOLUMNS(_tbl,"rank",rankx(_tbl,[value],,DESC,Dense))
VAR _count=COUNTROWS(FILTER(_tbl2,[rank]<=5))
return If(_count>5,IF([Measure]<5,1))
and add measure 2 to filter
pls see the attachment below
Proud to be a Super User!
This worked. I thought the solution involved creating virtual tables, but couldn't get them to work.
Thanks legend!!!
you are welcome
Proud to be a Super User!
Check out the May 2026 Power BI update to learn about new features.
Sign up to receive a private message when registration opens and key events begin.
If you have recently started exploring Fabric, we'd love to hear how it's going. Your feedback can help with product improvements.
| User | Count |
|---|---|
| 32 | |
| 26 | |
| 25 | |
| 24 | |
| 15 |
| User | Count |
|---|---|
| 61 | |
| 48 | |
| 26 | |
| 21 | |
| 20 |