Join us in Barcelona for FabCon and SQLCon, September 28 - October 1, 2026.
This is best Fabric, Power BI, SQL and AI community event. How do we know? The last event sold out! Save €200 with code FABCMTY200.
Register now- Power BI forums
- Get Help with Power BI
- Desktop
- Service
- Report Server
- Power Query
- Mobile Apps
- Developer
- DAX Commands and Tips
- Custom Visuals Development Discussion
- Health and Life Sciences
- Power BI Spanish forums
- Translated Spanish Desktop
- Training and Consulting
- Instructor Led Training
- Dashboard in a Day for Women, by Women
- Galleries
- Data Stories Gallery
- Themes Gallery
- Contests Gallery
- QuickViz Gallery
- Quick Measures Gallery
- Visual Calculations Gallery
- Fabric Apps Gallery
- Notebook Gallery
- Translytical Task Flow Gallery
- TMDL Gallery
- R Script Showcase
- Webinars and Video Gallery
- Ideas
- Custom Visuals Ideas (read-only)
- Issues
- Issues
- Events
- Upcoming Events
The Fabric community is upgrading! Read all of the details including the timeline and what you can expect. Learn more
- Power BI forums
- Forums
- Get Help with Power BI
- Desktop
- Re: Count Distinct combining two tables
- Subscribe to RSS Feed
- Mark Topic as New
- Mark Topic as Read
- Float this Topic for Current User
- Bookmark
- Subscribe
- Printer Friendly Page


- Mark as New
- Bookmark
- Subscribe
- Mute
- Subscribe to RSS Feed
- Permalink
- Report Inappropriate Content
Count Distinct combining two tables
Hi all,
Hope you can help me. Been struggling with this for some time now. I have two tables: one with employee data and another with their projectassignments. I just need a simple grid with their names and number of assignments. Can you please help as this count of assignment measure drives me mad.
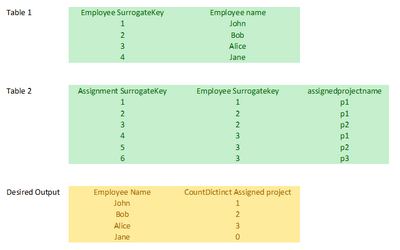
Thanks in advance.
Solved! Go to Solution.


- Mark as New
- Bookmark
- Subscribe
- Mute
- Subscribe to RSS Feed
- Permalink
- Report Inappropriate Content
@MarcoDekker Try:
Measure = COUNTROWS(DISTINCT(SELECTCOLUMNS('Table 2',"__name",[assignedprojectname]))) + 0Follow on LinkedIn
@ me in replies or I'll lose your thread!!!
Instead of a Kudo, please vote for this idea
Become an expert!: Enterprise DNA
External Tools: MSHGQM
YouTube Channel!: Microsoft Hates Greg
Latest book!: DAX For Humans
DAX is easy, CALCULATE makes DAX hard...
- Mark as New
- Bookmark
- Subscribe
- Mute
- Subscribe to RSS Feed
- Permalink
- Report Inappropriate Content
- Mark as New
- Bookmark
- Subscribe
- Mute
- Subscribe to RSS Feed
- Permalink
- Report Inappropriate Content
hi @Greg_Deckler, Thanks a lot. it works indeed! I have one more question.
In table 1 i have more columns. When i create the report and add more attributes from this table, i get some kind of cartesian product. Why is this?
b.t.w. i create visualisations with direct query on a tabular model.
- Mark as New
- Bookmark
- Subscribe
- Mute
- Subscribe to RSS Feed
- Permalink
- Report Inappropriate Content
@MarcoDekker I'm not sure. Can you share a screen shot or more information?
Follow on LinkedIn
@ me in replies or I'll lose your thread!!!
Instead of a Kudo, please vote for this idea
Become an expert!: Enterprise DNA
External Tools: MSHGQM
YouTube Channel!: Microsoft Hates Greg
Latest book!: DAX For Humans
DAX is easy, CALCULATE makes DAX hard...
- Mark as New
- Bookmark
- Subscribe
- Mute
- Subscribe to RSS Feed
- Permalink
- Report Inappropriate Content
Hi @Greg_Deckler . Alas, not able to reproduce this behaviour in the test pibx. Will continue to try.
But i realised, i miss Jane in the output. Can we generate some kind of left outer join in Dax? Jane does not have projects assigned, yet she need to show up in the report.
- Mark as New
- Bookmark
- Subscribe
- Mute
- Subscribe to RSS Feed
- Permalink
- Report Inappropriate Content
@MarcoDekker Try:
Measure = COUNTROWS(DISTINCT(SELECTCOLUMNS('Table 2',"__name",[assignedprojectname]))) + 0Follow on LinkedIn
@ me in replies or I'll lose your thread!!!
Instead of a Kudo, please vote for this idea
Become an expert!: Enterprise DNA
External Tools: MSHGQM
YouTube Channel!: Microsoft Hates Greg
Latest book!: DAX For Humans
DAX is easy, CALCULATE makes DAX hard...
- Mark as New
- Bookmark
- Subscribe
- Mute
- Subscribe to RSS Feed
- Permalink
- Report Inappropriate Content
@MarcoDekker Try:
Measure = COUNTROWS(DISTINCT(SELECTCOLUMNS('Table 2',"__name",[assignedprojectname])))Follow on LinkedIn
@ me in replies or I'll lose your thread!!!
Instead of a Kudo, please vote for this idea
Become an expert!: Enterprise DNA
External Tools: MSHGQM
YouTube Channel!: Microsoft Hates Greg
Latest book!: DAX For Humans
DAX is easy, CALCULATE makes DAX hard...

Helpful resources

FabCon & SQLCon – Barcelona 2026
Join us in Barcelona for FabCon and SQLCon, the Fabric, Power BI, SQL, and AI community event. Save €200 with code FABCMTY200.

Power BI DataViz World Championships - June 2026
A new Power BI DataViz World Championship is coming this June! Don't miss out on submitting your entry.

| User | Count |
|---|---|
| 24 | |
| 22 | |
| 20 | |
| 18 | |
| 14 |


| User | Count |
|---|---|
| 31 | |
| 26 | |
| 23 | |
| 20 | |
| 20 |


