This is best Fabric, Power BI, SQL and AI community event. How do we know? The last event sold out! Save €200 with code FABCMTY200.
Register nowJuly 28 - August 9 | Final Round of the Power BI Dataviz World Championships. This is your chance. Learn more
Hi all,
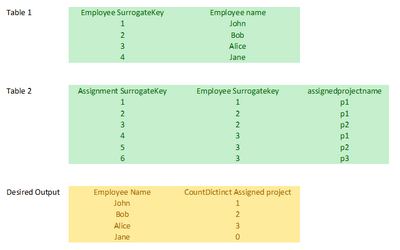
Hope you can help me. Been struggling with this for some time now. I have two tables: one with employee data and another with their projectassignments. I just need a simple grid with their names and number of assignments. Can you please help as this count of assignment measure drives me mad.
Thanks in advance.
Solved! Go to Solution.
@MarcoDekker Try:
Measure = COUNTROWS(DISTINCT(SELECTCOLUMNS('Table 2',"__name",[assignedprojectname]))) + 0
hi @Greg_Deckler, Thanks a lot. it works indeed! I have one more question.
In table 1 i have more columns. When i create the report and add more attributes from this table, i get some kind of cartesian product. Why is this?
b.t.w. i create visualisations with direct query on a tabular model.
@MarcoDekker I'm not sure. Can you share a screen shot or more information?
Hi @Greg_Deckler . Alas, not able to reproduce this behaviour in the test pibx. Will continue to try.
But i realised, i miss Jane in the output. Can we generate some kind of left outer join in Dax? Jane does not have projects assigned, yet she need to show up in the report.
@MarcoDekker Try:
Measure = COUNTROWS(DISTINCT(SELECTCOLUMNS('Table 2',"__name",[assignedprojectname]))) + 0
@MarcoDekker Try:
Measure = COUNTROWS(DISTINCT(SELECTCOLUMNS('Table 2',"__name",[assignedprojectname])))
Join us in Barcelona for FabCon and SQLCon, the Fabric, Power BI, SQL, and AI community event. Save €200 with code FABCMTY200.
If you love stickers, then you will definitely want to check out our community sticker challenge, Barcelona edition!
Check out the July 2026 Power BI update to learn about new features.
| User | Count |
|---|---|
| 25 | |
| 23 | |
| 22 | |
| 17 | |
| 14 |
| User | Count |
|---|---|
| 25 | |
| 24 | |
| 20 | |
| 19 | |
| 19 |