Get certified for free when you join Fabric Data Days 2026 and dive into Fabric, Power BI, SQL, AI, and other essential data skills.
Join nowJuly 28 - August 9 | Final Round of the Power BI Dataviz World Championships. This is your chance. Learn more
Hello,
I have created a report subscription so my Power BI report is sent to multiple customers. The issue I (and they) are experiencing is the table on the slide being sent it too large (length and width) to be displayed on the page without scrolling. The email subscription appears to only include a screenshot of the page. Is there any way for the subscription to contain the entire contents of the slide being sent, or is the only option to include a screenshot?
Thanks,
Matt
Solved! Go to Solution.
Hi, @EH_MW
The table in your report is too large to be fully displayed in an email subscription that only captures a screenshot of the page. You can solve this problem in the following ways:
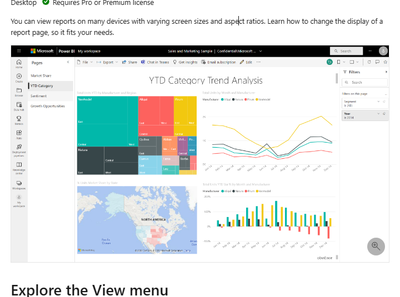
First, Before setting up your subscription, resize your form so that it is in the visual area. You can refer to the following articles:
Change the display size and ratio of a report page - Power BI | Microsoft Learn
secondly, You can try to use paginated reports. If you can't adjust the layout because of the complexity or amount of data you need to display, consider using a paginated report in Power BI. Paginated reports are designed to be printed or shared because they allow content to be split into multiple pages, ensuring that large tables can be fully contained.
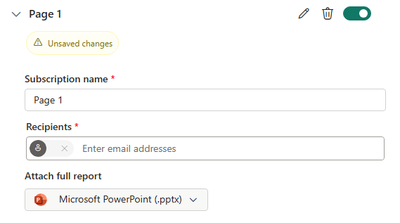
In addition, you can attach the entire report as shown in the following image:
How to Get Your Question Answered Quickly
Best Regards
Jianpeng Li
If this post helps, then please consider Accept it as the solution to help the other members find it more quickly.
Hi, @EH_MW
The table in your report is too large to be fully displayed in an email subscription that only captures a screenshot of the page. You can solve this problem in the following ways:
First, Before setting up your subscription, resize your form so that it is in the visual area. You can refer to the following articles:
Change the display size and ratio of a report page - Power BI | Microsoft Learn
secondly, You can try to use paginated reports. If you can't adjust the layout because of the complexity or amount of data you need to display, consider using a paginated report in Power BI. Paginated reports are designed to be printed or shared because they allow content to be split into multiple pages, ensuring that large tables can be fully contained.
In addition, you can attach the entire report as shown in the following image:
How to Get Your Question Answered Quickly
Best Regards
Jianpeng Li
If this post helps, then please consider Accept it as the solution to help the other members find it more quickly.
Join us in Barcelona for FabCon and SQLCon, the Fabric, Power BI, SQL, and AI community event. Save €200 with code FABCMTY200.
If you love stickers, then you will definitely want to check out our community sticker challenge, Barcelona edition!
Check out the July 2026 Power BI update to learn about new features.
| User | Count |
|---|---|
| 14 | |
| 9 | |
| 9 | |
| 8 | |
| 6 |