This is best Fabric, Power BI, SQL and AI community event. How do we know? The last event sold out! Save €200 with code FABCMTY200.
Register nowA new Data Days event is coming soon! This time we’re going bigger than ever. Fabric, Power BI, SQL, AI and more. Don't miss out.
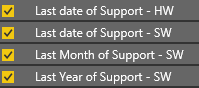
I am using 2 columns in excel formatted as dates to generate two separate bar charts in power BI. One column shows in fields as broken down into date, month, year and so allows me to sort and manipulate the data (see picture. However the other column does not have it's date separated in the fields (missing Month and Year) so I can't sort it properly.
I thought it may be because one column was sourced using a vlookup but I changed this to the same date format as the other one(copied and pasted as text, then coverted to date) and I'm still having the same issue.
Stuck on this so would appreciate any help.
What data type are these showing as in Power BI? Are they both dates or is one formatted as text?
Hi thanks for replying. How do I check this? I'm new to Power BI and am using the web version.
Check out the May 2026 Power BI update to learn about new features.
Sign up to receive a private message when registration opens and key events begin.
If you have recently started exploring Fabric, we'd love to hear how it's going. Your feedback can help with product improvements.
| User | Count |
|---|---|
| 10 | |
| 8 | |
| 8 | |
| 7 | |
| 6 |
| User | Count |
|---|---|
| 24 | |
| 21 | |
| 18 | |
| 17 | |
| 16 |