Get certified for free when you join Fabric Data Days 2026 and dive into Fabric, Power BI, SQL, AI, and other essential data skills.
Join nowJuly 7 - July 17 | Round 2 of the Power BI Dataviz World Championships. Don't miss your chance! Learn more
Hi,
on my PowerBI Service account the Filled Map doesn't work, ever, both when I use it directly from Service and when i publish a report from Desktop; is there anyone who has ever encouterd this problem?
Thank you!
Solved! Go to Solution.
I can't believe it, I used Firefox and it works so the problem it's the browser but I don't think this should ever happen!!!
What do you mean "doesn't work"? Does it throw error or return incorrect result?
Please share some screenshots if possible.
Regards,
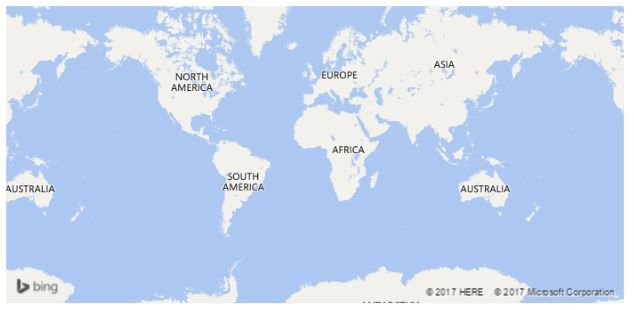
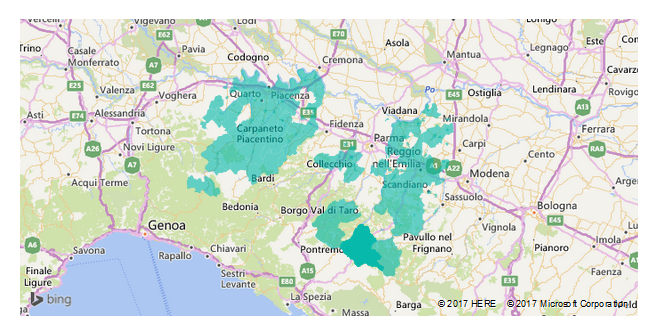
I mean that the selection doesn't work, area don't get coloured the way they should, they don't get coloured at all.
In the second picture there's the correct map, how my collegue sees it, but when he shared it to me, I could see it as you can see in the first pucture.
I can't believe it, I used Firefox and it works so the problem it's the browser but I don't think this should ever happen!!!
Join us in Barcelona for FabCon and SQLCon, the Fabric, Power BI, SQL, and AI community event. Save €200 with code FABCMTY200.
Join Data Days 2026: 60 days of free live/on-demand sessions, challenges, study groups, and certification opportunities.
| User | Count |
|---|---|
| 23 | |
| 12 | |
| 10 | |
| 10 | |
| 4 |
| User | Count |
|---|---|
| 33 | |
| 29 | |
| 27 | |
| 26 | |
| 21 |