This is best Fabric, Power BI, SQL and AI community event. How do we know? The last event sold out! Save €200 with code FABCMTY200.
Register nowA new Data Days event is coming soon! This time we’re going bigger than ever. Fabric, Power BI, SQL, AI and more. Don't miss out.
I was viewing this sample https://powerbi.microsoft.com/en-us/documentation/powerbi-sample-human-resources-take-a-tour/ and I would love to recreate those visuals with our company data. I have reports in excel format, but I am not sure what data I need and how to format it so that I can view the same types of reports. When I try to download the data in excel, I can either view the summarized version, which doesn't seem to come close to what I need and then I can look at the full version, which has everything parsed out after PowerBI analyzed the data.
I would love a tutorial on what exactly I need to put together on an excel spreadsheet and how to upload/edit the data so that I can have the same views.
Solved! Go to Solution.
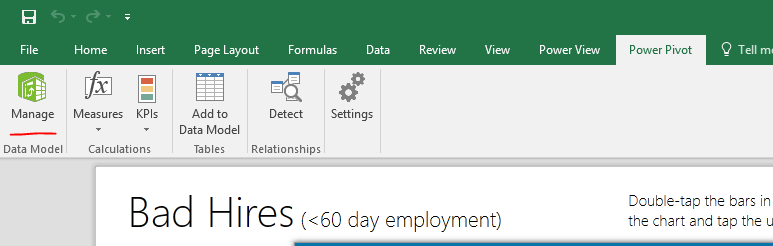
In the sample workbook, the Power View report is fed by a Power Pivot model. You need to import those tables into Power Pivot, then build into a data model. You can also use Power BI Desktop connect this workbook for creating reports.
For more details, please see:
Use the Data Model in Power View
Regards,
In the sample workbook, the Power View report is fed by a Power Pivot model. You need to import those tables into Power Pivot, then build into a data model. You can also use Power BI Desktop connect this workbook for creating reports.
For more details, please see:
Use the Data Model in Power View
Regards,
Check out the May 2026 Power BI update to learn about new features.
Sign up to receive a private message when registration opens and key events begin.
If you have recently started exploring Fabric, we'd love to hear how it's going. Your feedback can help with product improvements.
| User | Count |
|---|---|
| 8 | |
| 8 | |
| 8 | |
| 8 | |
| 7 |
| User | Count |
|---|---|
| 21 | |
| 21 | |
| 18 | |
| 16 | |
| 13 |