This is best Fabric, Power BI, SQL and AI community event. How do we know? The last event sold out! Save €200 with code FABCMTY200.
Register nowThe Fabric community is now in read-only for platform upgrade. Learn more
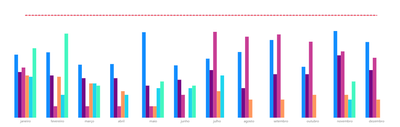
I created a bar chart with a limit line, but each bar is from a different base that I did the data modeling.
I am not finding the option to make a conditional color that if it is greater than the boundary line turns red, if it is less than the boundary line turns green.
can you help me ?
You do not have the option of conditional formatting in colors.
Solved! Go to Solution.
Hey @Anonymous ,
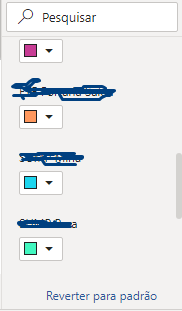
this is simply not possible, as Power BI does not allow to change the fill color if the color is used for identifying the single "member" inside a cluster. The fill color will be automatically applied to the members inside a cluster, based on the color in the legend (the single member). It's not possible to overwrite the fill color using conditional formatting.
Maybe, you will create an idea on ideas.powerbi.com
Regards,
Tom
Hi,
If the above post helps, could you please consider Accept it as the solution to help the other members find it more quickly. thanks!
Hey @Anonymous ,
this is simply not possible, as Power BI does not allow to change the fill color if the color is used for identifying the single "member" inside a cluster. The fill color will be automatically applied to the members inside a cluster, based on the color in the legend (the single member). It's not possible to overwrite the fill color using conditional formatting.
Maybe, you will create an idea on ideas.powerbi.com
Regards,
Tom
Join us in Barcelona for FabCon and SQLCon, the Fabric, Power BI, SQL, and AI community event. Save €200 with code FABCMTY200.
| User | Count |
|---|---|
| 15 | |
| 11 | |
| 9 | |
| 8 | |
| 6 |
| User | Count |
|---|---|
| 29 | |
| 23 | |
| 18 | |
| 15 | |
| 13 |