cancel
Showing results for 
Search instead for 
Did you mean: 

A new Data Days event is coming soon! This time we’re going bigger than ever. Fabric, Power BI, SQL, AI and more. Don't miss out.

Reply
aishak12
Helper IV
Helper IV

Combining two visuals

All, 


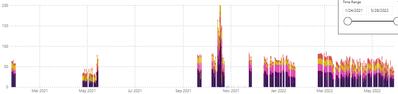
I have two stacked column charts. I want to combine the visuals to plot both values into one chart. It should show two different colors in the new chart.


The SUM value in chart 1 in one color and the SUM value in chart 2 in another color. 


1) 

Label 1,2,3,4 Selected:

aishak12_0-1659275258109.png


2) 

Label 5 Selected:

aishak12_1-1659275275249.png


This is the format of my data:


Column 1)                 Column 2)

Label 1                       10

Label 2                       20

Label 3                       30

Label 4                       25

Label 5                       40

1 ACCEPTED SOLUTION
gauthamboppana
Solution Specialist
Solution Specialist

@aishak12  - Create two new measures. Ones for summing up labels 1,2,3,4  and another for label 5.  You can use these two measures in the column charts.

Sum1 =  calculate( sum([column2]),  [column1] in {"Label 1","Label 2","Label 3","Label 4"}
Sum2 =  calculate( sum([column2]),  [column1] = "Label 5")

Let me know if you have any questions.

Did I answer your question? Mark my post as a solution! If not, please feel free to ask me.

Also, I would ❤ Kudos if my solution helped.  It is a token of appreciation!

Thank you very much !


View solution in original post

1 REPLY 1
gauthamboppana
Solution Specialist
Solution Specialist

@aishak12  - Create two new measures. Ones for summing up labels 1,2,3,4  and another for label 5.  You can use these two measures in the column charts.

Sum1 =  calculate( sum([column2]),  [column1] in {"Label 1","Label 2","Label 3","Label 4"}
Sum2 =  calculate( sum([column2]),  [column1] = "Label 5")

Let me know if you have any questions.

Did I answer your question? Mark my post as a solution! If not, please feel free to ask me.

Also, I would ❤ Kudos if my solution helped.  It is a token of appreciation!

Thank you very much !


Helpful resources

Announcements
May Power BI Update Carousel

Power BI Monthly Update - May 2026

Check out the May 2026 Power BI update to learn about new features.

Fabric SQL PBI Data Days

Data Days 2026 coming soon!

Sign up to receive a private message when registration opens and key events begin.

New to Fabric survey Carousel

New to Fabric Survey

If you have recently started exploring Fabric, we'd love to hear how it's going. Your feedback can help with product improvements.

Power BI DataViz World Championships carousel

Power BI DataViz World Championships - June 2026

A new Power BI DataViz World Championship is coming this June! Don't miss out on submitting your entry.