Join us at FabCon Vienna from September 15-18, 2025
The ultimate Fabric, Power BI, SQL, and AI community-led learning event. Save €200 with code FABCOMM.
Get registered- Power BI forums
- Get Help with Power BI
- Desktop
- Service
- Report Server
- Power Query
- Mobile Apps
- Developer
- DAX Commands and Tips
- Custom Visuals Development Discussion
- Health and Life Sciences
- Power BI Spanish forums
- Translated Spanish Desktop
- Training and Consulting
- Instructor Led Training
- Dashboard in a Day for Women, by Women
- Galleries
- Data Stories Gallery
- Themes Gallery
- Contests Gallery
- Quick Measures Gallery
- Notebook Gallery
- Translytical Task Flow Gallery
- TMDL Gallery
- R Script Showcase
- Webinars and Video Gallery
- Ideas
- Custom Visuals Ideas (read-only)
- Issues
- Issues
- Events
- Upcoming Events
Enhance your career with this limited time 50% discount on Fabric and Power BI exams. Ends August 31st. Request your voucher.
- Power BI forums
- Forums
- Get Help with Power BI
- Service
- Re: Can I run a query to quantify the memory footp...
- Subscribe to RSS Feed
- Mark Topic as New
- Mark Topic as Read
- Float this Topic for Current User
- Bookmark
- Subscribe
- Printer Friendly Page
- Mark as New
- Bookmark
- Subscribe
- Mute
- Subscribe to RSS Feed
- Permalink
- Report Inappropriate Content
Can I run a query to quantify the memory footprint of a published Power BI report?
I want to identify datasets on our Premium capacity (P2) that are at risk of failing, because they are getting too large for the capacity.
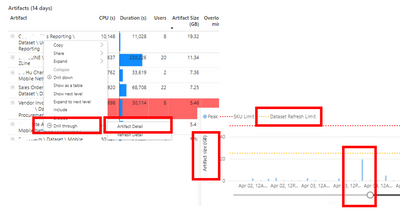
In the Power BI Premium "Capacity Metrics App it is possible to view the size of a Power BI "artifact" (dataset) relative to the "Dataset Refresh Limit" (see yellow line in screenshot below). Based on this Guy in a Cube video, I am assuming artifact size vs dataset refresh limit is a good ratio to assess the risk of a Power BI refresh failing (Or to pre-emptively identify datasets that need optimizing).
Limitations of the Capacity Metrics app, incude:
- Metrics aren't shown in real time
- You need to manually investigate each Power BI report to view the artifiact metrics.
- you can't set up alerts.
Therefore, my question is, is there an alternative way to run a query to obtain the memory/RAM consumption of a published Power BI report?
I have read this post that suggests running a Dynamic Management View (DMV) query in DAX studio against a Desktop PBIX file can return the size of columns and tables. Such as
SELECT dimension_name AS tablename,
attribute_name AS columnname,
datatype,(dictionary_size/1024) AS size_kb
FROM $system.discover_storage_table_columns
I can also run this same DMV against the XMLA endpoint (Tabular Server), but I am unclear if this would provide the "True" memory footprint / artifiact size of the Power BI dataset in the Service. For example both the memory/RAM usage linked to the
- the dataset refresh
- users interacting with the report (Temp tables being produced by the execution of DAX queries etc.)
Can anyone advise if there is a way to run a query to obtain the memory/RAM consumption of a published Power BI report?
Thanks in Advance
Screenshot from Premium Capacity ap showing artifact size
Solved! Go to Solution.
- Mark as New
- Bookmark
- Subscribe
- Mute
- Subscribe to RSS Feed
- Permalink
- Report Inappropriate Content
The DMV is the best you can do at the moment. BUT- keep in mind that compression plays a role too and the memory usage in the capacity can and will be different from the dataset file size.
Check the eviction stats. Also - there is a newfangled grey UI bar (black font on grey background, yay!!!) that indicates if a dataset is becoming too large for the capacity.
- Mark as New
- Bookmark
- Subscribe
- Mute
- Subscribe to RSS Feed
- Permalink
- Report Inappropriate Content
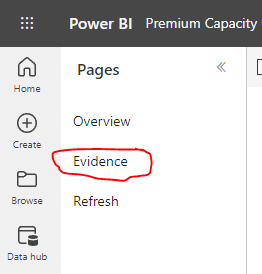
Thanks @lbendlin . Yes, it apears the DMV only provides a partial picture of the total memory usage. I was looking to replicate the equivalent view that the capacity metrics app produces. It seems the Capacity app provides the same view of RAM & CPU usage in the Power BI Service, that the Task Manager produces on the desktop. When you say "eviction stats" do you mean the "Evidence" Tab in the Capacity Metrics App (see below)?
- Mark as New
- Bookmark
- Subscribe
- Mute
- Subscribe to RSS Feed
- Permalink
- Report Inappropriate Content
No, I mean evictions. When a dataset gets kicked out of memory to make space for another one.
- Mark as New
- Bookmark
- Subscribe
- Mute
- Subscribe to RSS Feed
- Permalink
- Report Inappropriate Content
hi @lbendlin,
i'm traying to qunatify the evictions within my capacity / workspaces. you've mention earlier the eviction stats. where can i find them? the prev version on premium capacity app has the eviction tracking, the latest version, however, seems to miss that info.
also scanned throught the logs in log analytics for any kind of eviction info with no sucess to date. any ideas how to retrieve that info?
- Mark as New
- Bookmark
- Subscribe
- Mute
- Subscribe to RSS Feed
- Permalink
- Report Inappropriate Content
I don't think evictions are a valid concept in Fabric any more. Now it's all CUs, overages and burndowns.
- Mark as New
- Bookmark
- Subscribe
- Mute
- Subscribe to RSS Feed
- Permalink
- Report Inappropriate Content
Is it though? I can still find in ms docs the following:
https://learn.microsoft.com/en-us/power-bi/enterprise/service-premium-large-models#semantic-model-ev...
It does indicate that if my model gets evicted and that will happen, according to my understanding, when it is inactive for some time or to make space for other sematic models, then:
If you have to wait for an evicted semantic model to be reloaded, you might experience a noticeable delay.
- Mark as New
- Bookmark
- Subscribe
- Mute
- Subscribe to RSS Feed
- Permalink
- Report Inappropriate Content
Yep, that would make sense. However there is no place in the new Fabric Capacity Metrics app where evictions ( or memory) are mentioned. Only Compute and (Fabric) Storage
Helpful resources
| User | Count |
|---|---|
| 43 | |
| 15 | |
| 12 | |
| 11 | |
| 8 |
| User | Count |
|---|---|
| 51 | |
| 31 | |
| 20 | |
| 18 | |
| 15 |


