cancel
Showing results for 
Search instead for 
Did you mean: 

July 28 - August 9 | Final Round of the Power BI Dataviz World Championships. This is your chance. Learn more

Reply
rebecka
Frequent Visitor

Top N Table

Hi,

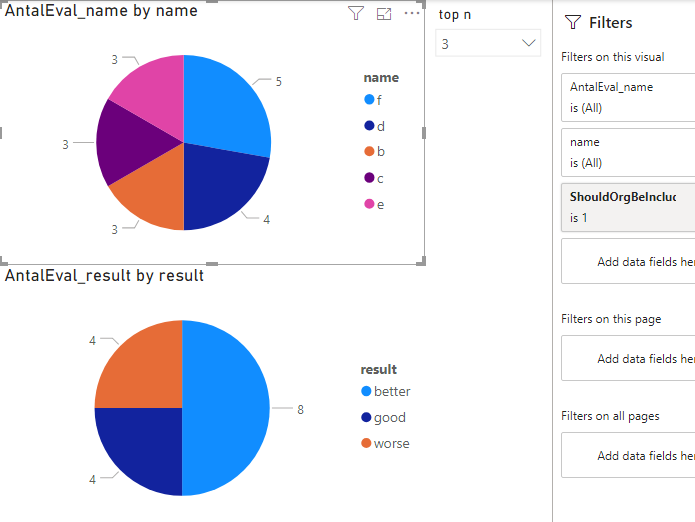
I have a report where I would like to present data from my Top N customers (N is selected in the report). To present which customer that are my Top N is no problem (see visual with header AntalEval_name by name).

But the problem is to the present data connected to my Top N customers (see visual with header AntalEval_result by result).

dump1.PNG

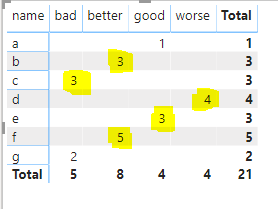
The second visual is not correct. I would like to present the highlighted yellow data in the visual below. That is the result for my Top N customer (when N=3 my top customers are b, c, d, e, f, according to the above visual (b, c and e are in shared 3rd place)).

Skärmklipp.PNG


6 REPLIES 6
dax
Community Support
Community Support

Hi rebecka, 

I am not sure whether this is what you want, please refer to my sample to see whether it work or not. If this is not what you want, please correct me.

Best Regards,
Zoe Zhi

If this post helps, then please consider Accept it as the solution to help the other members find it more quickly.


rebecka
Frequent Visitor

Hi @dax !

The solution is not correct unfortunately.

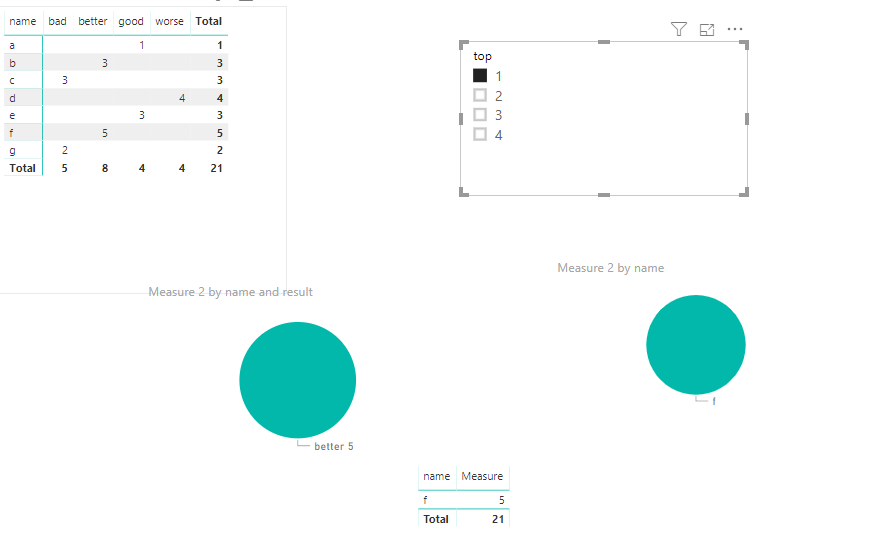
The top N should rank the names according to the sum of amount, so Top 1 in your .pbix is name f. And therefore we want Better 5 when choosing Top 1 (since that is f's result).

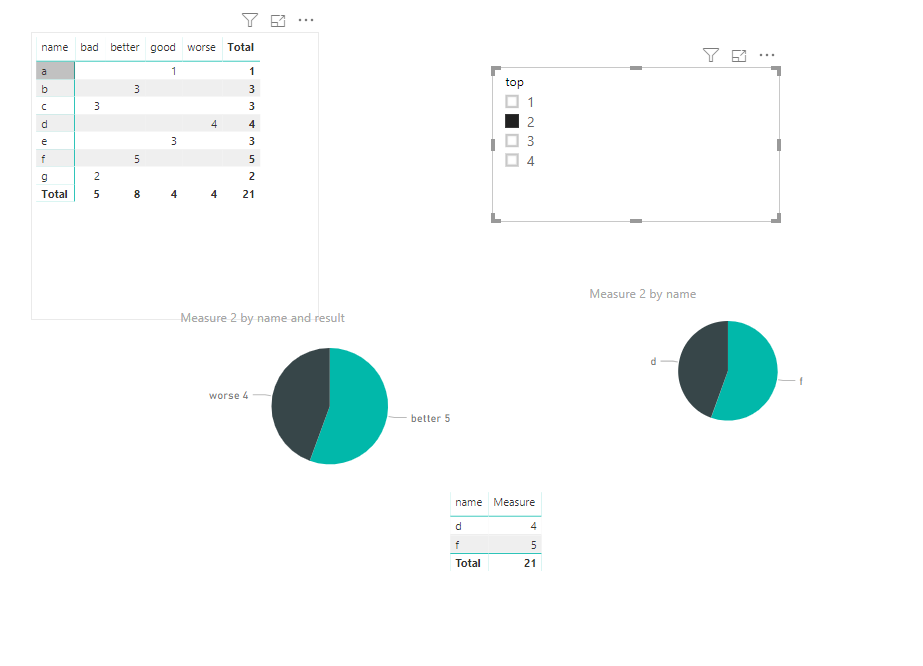
Our Top 2 is d and f, and therefore should the pie chart show better 5 and worse 4 (the result of d and f).

Do you follow?

Can you fix that, would love if you can give it a try!

Best Regards, Rebecka

dax
Community Support
Community Support

Hi rebecka,

I thought you want to get measure for second image, so I just create measure for result. If you want to get top N of name, you could use another measure like below

Measure = if(SELECTEDVALUE(slicer[top])>=RaNKX(ALLSELECTED('Table'),CALCULATE(SUM('Table'[amount]), ALLEXCEPT('Table','Table'[name])),,DESC,Dense),CALCULATE(SUM('Table'[amount]), ALLEXCEPT('Table','Table'[name])),BLANK())

You could referto my sample for details. 

Best Regards,
Zoe Zhi

If this post helps, then please consider Accept it as the solution to help the other members find it more quickly.


rebecka
Frequent Visitor

Hi again @dax !

I can calculate Top N for name that's not the problem.

And I don't want Top N for result, I want the result from my Top N names.

Do you see the difference?

Your new measure doesn't present the correct numbers as a mentioned in my previous answer.

Best Regards,

Rebecka

dax
Community Support
Community Support

Hi rebecka, 

Did you mean you want to get result like below?

504.PNG505.PNG

If so, you could refer to my sample. If not, please correct me.

Best Regards,
Zoe Zhi

If this post helps, then please consider Accept it as the solution to help the other members find it more quickly.


rebecka
Frequent Visitor

Hi @dax !

It's sort of right. But when you choose Top 3 you get two slice's both with the result better (one with 3 and one with 5), i would like one slice with better 8.

Best Regards,

Rebecka


Helpful resources

Announcements
FabCon and SQLCon Barcelona 2026

FabCon & SQLCon – Barcelona 2026

Join us in Barcelona for FabCon and SQLCon, the Fabric, Power BI, SQL, and AI community event. Save €200 with code FABCMTY200.

Fabric Community Sticker Design Challenge Barcelona Carousel

Fabric Community Sticker Challenge - Barcelona 2026

If you love stickers, then you will definitely want to check out our community sticker challenge, Barcelona edition!

July Power BI Update Carousel

Power BI Monthly Update - July 2026

Check out the July 2026 Power BI update to learn about new features.

Power BI DataViz World Championships carousel

Power BI DataViz World Championships - June 2026

A new Power BI DataViz World Championship is coming this June! Don't miss out on submitting your entry.

Top Kudoed Authors