Get certified for free when you join Fabric Data Days 2026 and dive into Fabric, Power BI, SQL, AI, and other essential data skills.
Join nowJuly 7 - July 17 | Round 2 of the Power BI Dataviz World Championships. Don't miss your chance! Learn more
Hi, I am new to Power Bi,
I am trying to work out my net adds for the month.
Can anyone advise which would be the best Dax formula for this or query?
I can post data if need be
Solved! Go to Solution.
Hi @Anonymous ,
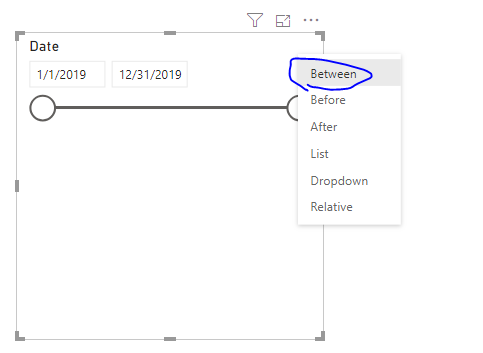
Setting the slicer to between as below should help you.
Hi @Anonymous ,
Setting the slicer to between as below should help you.
Hi
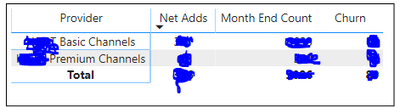
That will work; however, I am producing my data in a matrix along with other measures. I am replicating a report in Power BI from Excel. See picture of data below.
Hope this helps.
@v-frfei-msft @Anonymous
NetGroup2 =
VAR StartDateNet = CALCULATE(SUM(Test[Quantity]),Test[Brand]="Group2",ALLSELECTED(Test[StartDate]))
VAR ServiceEndDateNet = CALCULATE(SUM(Test[Quantity]),Test[Brand]="Group2",ALLSELECTED(Test[StartDate],Test[ServiceEndDate]))
RETURN StartDateNet
Hi Vimal,
Thank you for you're help so far.
I have more than 1 brand in my data that I need to include. I can sort this by adding a filter on the visual.
My main concern is that is there no way to add a date field such as "DatesBetween" in the below dax expression? I want to Power BI to give me net adds for September only. @Anonymous
Join us in Barcelona for FabCon and SQLCon, the Fabric, Power BI, SQL, and AI community event. Save €200 with code FABCMTY200.
Join Data Days 2026: 60 days of free live/on-demand sessions, challenges, study groups, and certification opportunities.