Get certified for free when you join Fabric Data Days 2026 and dive into Fabric, Power BI, SQL, AI, and other essential data skills.
Join nowJuly 28 - August 9 | Final Round of the Power BI Dataviz World Championships. This is your chance. Learn more
Hi, I am new to Power Bi,
I am trying to work out my net adds for the month.
Can anyone advise which would be the best Dax formula for this or query?
I can post data if need be
Solved! Go to Solution.
Hi @Anonymous ,
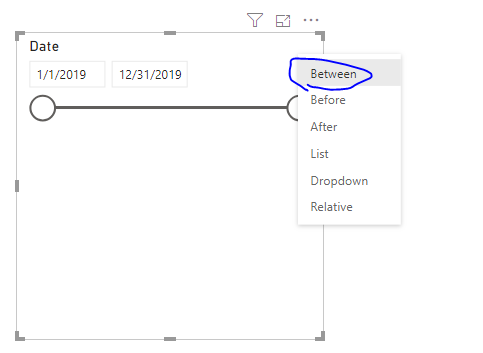
Setting the slicer to between as below should help you.
Hi @Anonymous ,
Setting the slicer to between as below should help you.
Hi
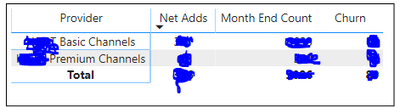
That will work; however, I am producing my data in a matrix along with other measures. I am replicating a report in Power BI from Excel. See picture of data below.
Hope this helps.
@v-frfei-msft @Anonymous
NetGroup2 =
VAR StartDateNet = CALCULATE(SUM(Test[Quantity]),Test[Brand]="Group2",ALLSELECTED(Test[StartDate]))
VAR ServiceEndDateNet = CALCULATE(SUM(Test[Quantity]),Test[Brand]="Group2",ALLSELECTED(Test[StartDate],Test[ServiceEndDate]))
RETURN StartDateNet
Hi Vimal,
Thank you for you're help so far.
I have more than 1 brand in my data that I need to include. I can sort this by adding a filter on the visual.
My main concern is that is there no way to add a date field such as "DatesBetween" in the below dax expression? I want to Power BI to give me net adds for September only. @Anonymous
Join us in Barcelona for FabCon and SQLCon, the Fabric, Power BI, SQL, and AI community event. Save €200 with code FABCMTY200.
If you love stickers, then you will definitely want to check out our community sticker challenge, Barcelona edition!
Check out the July 2026 Power BI update to learn about new features.