Get certified for free when you join Fabric Data Days 2026 and dive into Fabric, Power BI, SQL, AI, and other essential data skills.
Join nowJuly 7 - July 17 | Round 2 of the Power BI Dataviz World Championships. Don't miss your chance! Learn more
Hi all,
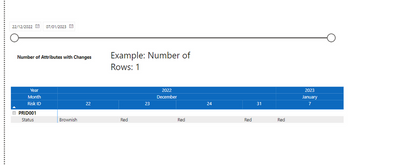
I am trying to create a visual which counts the number of distinct rows that are displayed on the matrix shown above.
Please note I have the measure in the matrix filters (distinctcount) to only show me rows that have different values in each date column (hopefully clearly shown)
E.g. There are rows which have the same data across the dates and therefore they are hidden.
Does anyone know how I can count the number of distinct rows showing based on the date range selected?
Full data sat can be found Below
pbix file: https://we.tl/t-vd5jYugdD6
Solved! Go to Solution.
Attributes with Changes =
var a = summarize('Project Risks Query-xxx','Project Risks Query-xxx'[Attribute],'Project Risks Query-xxx'[Risk ID],"ch",DISTINCTCOUNT('Project Risks Query-xxx'[Value]))
var b = summarize(filter(a,[ch]>1),[Attribute])
return countrows(b)
see attached
Please provide sanitized sample data that fully covers your issue.
Attributes with Changes =
var a = summarize('Project Risks Query-xxx','Project Risks Query-xxx'[Attribute],'Project Risks Query-xxx'[Risk ID],"ch",DISTINCTCOUNT('Project Risks Query-xxx'[Value]))
var b = summarize(filter(a,[ch]>1),[Attribute])
return countrows(b)
see attached
Join us in Barcelona for FabCon and SQLCon, the Fabric, Power BI, SQL, and AI community event. Save €200 with code FABCMTY200.
Check out the July 2026 Power BI update to learn about new features.
Join Data Days 2026: 60 days of free live/on-demand sessions, challenges, study groups, and certification opportunities.