Get certified for free when you join Fabric Data Days 2026 and dive into Fabric, Power BI, SQL, AI, and other essential data skills.
Join nowJuly 7 - July 17 | Round 2 of the Power BI Dataviz World Championships. Don't miss your chance! Learn more
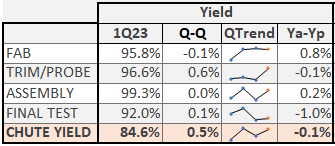
Hi. I created several Calcultaed measure on different Table query. Now, I need to create a summary table which will provide me different numbers per cell as below. Each cell in Yield and Cost column have different Calculated Measure from different query. How should I set it up?
I am still new in PowerBI, I only know the drag and drop form of tables.
Appreciate help on this. Thanks!
| Stage | Yield | Cost |
| Fab | FYield | Fcost |
| Probe | Pyield | Pcost |
| Assy | Ayield | Acost |
| Test | Tyield | Tcost |
Hi @kaye123
you can use cards for it and set them in a tabular form.
every card has shown different measure values and fixed them as a table.
Like.
Thanks for this. I have tried this. I am planning to setup multiple columns (around 30columns), replicating what i did in excel macro. Cards will might be crowded with this setup. Are there any options?
Hi @kaye123
I had the same requirement and I handled that by using the card, but if you don't want to use the card try matrix visual.
Note: Power BI might be different from excel, what did you do in excel sometimes it can't be implemented in Power bi.
That's why I prefer cards for this requirement and clients accept that.
Join us in Barcelona for FabCon and SQLCon, the Fabric, Power BI, SQL, and AI community event. Save €200 with code FABCMTY200.
If you love stickers, then you will definitely want to check out our community sticker challenge, Barcelona edition!
Check out the July 2026 Power BI update to learn about new features.