Get certified for free when you join Fabric Data Days 2026 and dive into Fabric, Power BI, SQL, AI, and other essential data skills.
Join nowJuly 7 - July 17 | Round 2 of the Power BI Dataviz World Championships. Don't miss your chance! Learn more
I tried using dygraph and plotly , but they give me any error or graph.
I used this: https://radacad.com/interactive-map-using-r-and-power-bi-create-custom-visual-part-1
If the chart is made non-interactive, then everything works.
Help me please!
what's the error message? Are you trying to plot to a non-standard output device?
I want to plot a simple interactive graph in power BI only.
I use:
rhtml template
"pbiviz package" does not throw errors
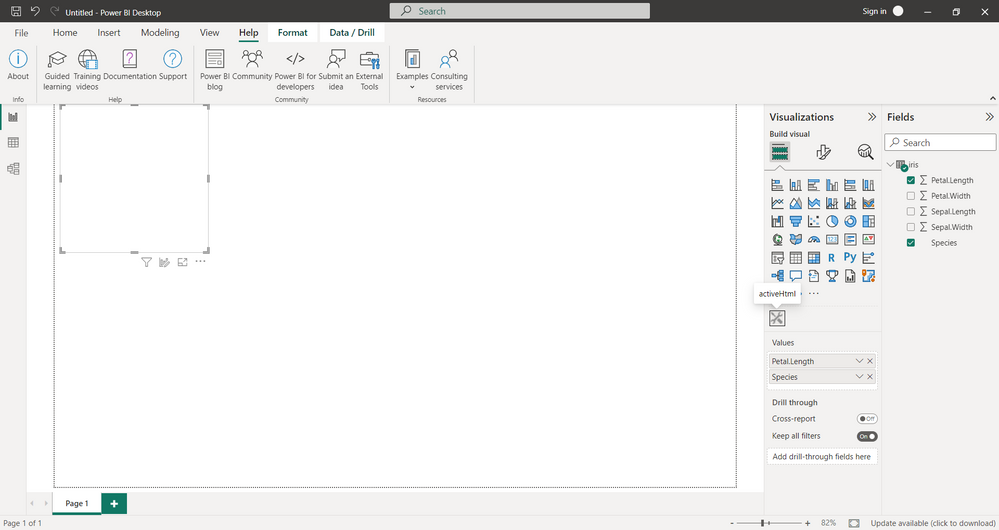
in power BI I have no errors, but and the graph is not visible too
How can i do this? I just used the template example. It says in the reviews that it works without any changes. Thanks a lotHow can I do this? I just used the "rhtml" template. It says in the reviews that it works without any changes. Thanks a lot
That would be a question for whoever wrote the reviews.
Join us in Barcelona for FabCon and SQLCon, the Fabric, Power BI, SQL, and AI community event. Save €200 with code FABCMTY200.
If you love stickers, then you will definitely want to check out our community sticker challenge, Barcelona edition!
Check out the July 2026 Power BI update to learn about new features.
| User | Count |
|---|---|
| 2 | |
| 2 | |
| 1 | |
| 1 | |
| 1 |