Get certified for free when you join Fabric Data Days 2026 and dive into Fabric, Power BI, SQL, AI, and other essential data skills.
Join nowJuly 7 - July 17 | Round 2 of the Power BI Dataviz World Championships. Don't miss your chance! Learn more
Hi All,
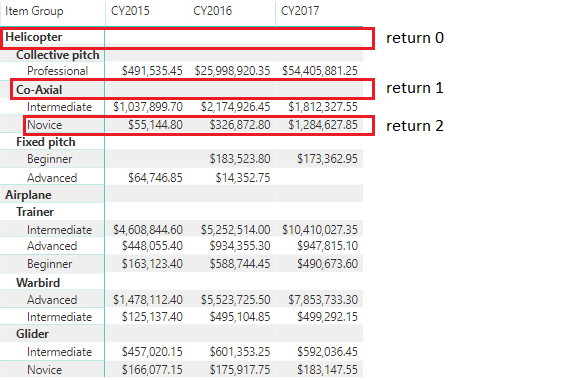
Considering a report that has a Power BI Matrix Visual, would it be possible to develop a Custom Visual that would know which level in the hierarchy was selected by the user? Or can I only do it by checking the highlighted values?
Thanks in advance for any feedback you could provide me.
@Anonymous - Yes, see my MM3TR&R - https://community.powerbi.com/t5/Quick-Measures-Gallery/Matrix-Measure-Total-Triple-Threat-Rock-amp-...
Also, ISINSCOPE is useful for this.
Thank you for the input.
I tried the ISINSCOPE function, but it doesn't work that well when you want to switch the legend of a clustered column chart.
I was planning to develop a new visual using d3/typescript, but then I don't know how to get the selected hierarchy level of the matrix.
Join us in Barcelona for FabCon and SQLCon, the Fabric, Power BI, SQL, and AI community event. Save €200 with code FABCMTY200.
Join Data Days 2026: 60 days of free live/on-demand sessions, challenges, study groups, and certification opportunities.
| User | Count |
|---|---|
| 2 | |
| 1 | |
| 1 | |
| 1 | |
| 1 |
| User | Count |
|---|---|
| 5 | |
| 3 | |
| 3 | |
| 2 | |
| 2 |