Get certified for free when you join Fabric Data Days 2026 and dive into Fabric, Power BI, SQL, AI, and other essential data skills.
Join nowJuly 28 - August 9 | Final Round of the Power BI Dataviz World Championships. This is your chance. Learn more
Hi
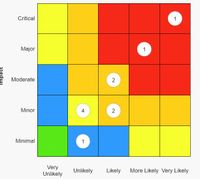
I need to be able to create a matrix like this which plots a value inside a matrix based on its score.
Could anyone offer some advice as to whether this would be possible and how it can be done?
Many Thanks
Solved! Go to Solution.
Hi @KG1,
I don't think you can do customize with matrix plot features.
For your scenario, I'd like to suggest you write a measure with if statement to check current row and column label to find out the score, then you can replace this score to other values based on condition.
Measure =
VAR currRowLable =
SELECTEDVALUE ( Table[Row] )
VAR currColLable =
SELECTEDVALUE ( Table[Column] )
VAR _score =
CALCULATE (
SUM ( Table[Score] ),
FILTER (
ALLSELECTED ( Table ),
[Column] IN currColLable
&& [Row] IN currRowLable
)
)
RETURN
IF ( _score > 10, 2, IF ( _score < 10 && _score > 5, 1, 0 ) )
Regards,
Xiaoxin Sheng
Hi @KG1,
I don't think you can do customize with matrix plot features.
For your scenario, I'd like to suggest you write a measure with if statement to check current row and column label to find out the score, then you can replace this score to other values based on condition.
Measure =
VAR currRowLable =
SELECTEDVALUE ( Table[Row] )
VAR currColLable =
SELECTEDVALUE ( Table[Column] )
VAR _score =
CALCULATE (
SUM ( Table[Score] ),
FILTER (
ALLSELECTED ( Table ),
[Column] IN currColLable
&& [Row] IN currRowLable
)
)
RETURN
IF ( _score > 10, 2, IF ( _score < 10 && _score > 5, 1, 0 ) )
Regards,
Xiaoxin Sheng
If you love stickers, then you will definitely want to check out our community sticker challenge, Barcelona edition!
Check out the July 2026 Power BI update to learn about new features.
| User | Count |
|---|---|
| 2 | |
| 1 | |
| 1 | |
| 1 | |
| 1 |
| User | Count |
|---|---|
| 4 | |
| 3 | |
| 2 | |
| 1 | |
| 1 |