

cancel
Showing results for 
Search instead for 
Did you mean: 

Level up your Power BI skills this month - build one visual each week and tell better stories with data! Get started

Reply
sandersonmm
Frequent Visitor

group by count distinct is grayed out

Hello,


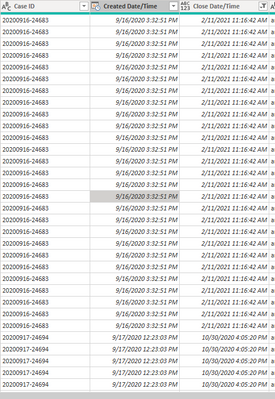
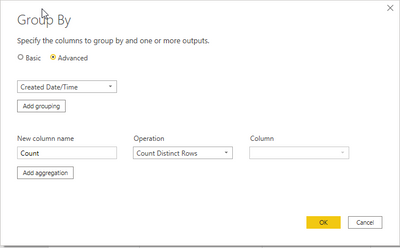
I am trying to group all my 'Create Date/Time' and 'Close Date/Time' and have a column that counts a distinct 'Case ID' . This is for a dual axis line graph (based on the dates) that counts a distinct 'Case ID'. Im trying to use the group by function in Power Query but the column is grayed out and wont let me select 'Case ID'.


sandersonmm_0-1651859910364.png


sandersonmm_1-1651860115813.png


1 ACCEPTED SOLUTION
Anonymous
Not applicable

Hi  @sandersonmm ,

Count Distinct Rows – Displays the distinct number of rows in a grouping.

When the Group by function selects Count-related operations, Column will not display columns, but will directly affect all rows. When operations such as SUM, AVG, etc. are selected, they will be displayed.

vyangliumsft_0-1652173509056.png


https://docs.microsoft.com/en-us/power-query/group-by

You can also do it with the dax function:

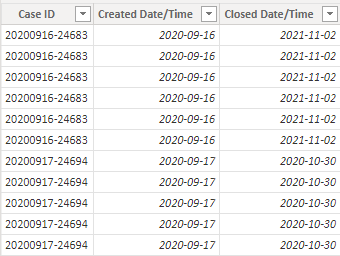
Main table:

vyangliumsft_1-1652173509059.png

Create calculated table.

Table 2 =
SUMMARIZE(
    'Table','Table'[Created Date/Time],'Table'[Closed Date/Time],"ID",DISTINCTCOUNT('Table'[Case ID]))

vyangliumsft_2-1652173509061.png


Best Regards,

Liu Yang

If this post helps, then please consider Accept it as the solution to help the other members find it more quickly.

View solution in original post

3 REPLIES 3
strongCoreZach
Advocate III
Advocate III

ignore the greyed out dropdown. Just click ok. 

Anonymous
Not applicable

Hi  @sandersonmm ,

Count Distinct Rows – Displays the distinct number of rows in a grouping.

When the Group by function selects Count-related operations, Column will not display columns, but will directly affect all rows. When operations such as SUM, AVG, etc. are selected, they will be displayed.

vyangliumsft_0-1652173509056.png


https://docs.microsoft.com/en-us/power-query/group-by

You can also do it with the dax function:

Main table:

vyangliumsft_1-1652173509059.png

Create calculated table.

Table 2 =
SUMMARIZE(
    'Table','Table'[Created Date/Time],'Table'[Closed Date/Time],"ID",DISTINCTCOUNT('Table'[Case ID]))

vyangliumsft_2-1652173509061.png


Best Regards,

Liu Yang

If this post helps, then please consider Accept it as the solution to help the other members find it more quickly.

Vijay_A_Verma
Most Valuable Professional

Can you click on Add Grouping button and from the drop down, it should allow you to choose Case ID?

Helpful resources

Announcements
April Power BI Update Carousel

Power BI Monthly Update - April 2026

Check out the April 2026 Power BI update to learn about new features.

Fabric SQL PBI Data Days

Data Days 2026 coming soon!

Sign up to receive a private message when registration opens and key events begin.

New to Fabric survey Carousel

New to Fabric Survey

If you have recently started exploring Fabric, we'd love to hear how it's going. Your feedback can help with product improvements.

Power BI DataViz World Championships carousel

Power BI DataViz World Championships - June 2026

A new Power BI DataViz World Championship is coming this June! Don't miss out on submitting your entry.