FabCon is coming to Atlanta
Join us at FabCon Atlanta from March 16 - 20, 2026, for the ultimate Fabric, Power BI, AI and SQL community-led event. Save $200 with code FABCOMM.
Register now!- Power BI forums
- Get Help with Power BI
- Desktop
- Service
- Report Server
- Power Query
- Mobile Apps
- Developer
- DAX Commands and Tips
- Custom Visuals Development Discussion
- Health and Life Sciences
- Power BI Spanish forums
- Translated Spanish Desktop
- Training and Consulting
- Instructor Led Training
- Dashboard in a Day for Women, by Women
- Galleries
- Data Stories Gallery
- Themes Gallery
- Contests Gallery
- QuickViz Gallery
- Quick Measures Gallery
- Visual Calculations Gallery
- Notebook Gallery
- Translytical Task Flow Gallery
- TMDL Gallery
- R Script Showcase
- Webinars and Video Gallery
- Ideas
- Custom Visuals Ideas (read-only)
- Issues
- Issues
- Events
- Upcoming Events
The Power BI Data Visualization World Championships is back! Get ahead of the game and start preparing now! Learn more
- Power BI forums
- Forums
- Get Help with Power BI
- Desktop
- Re: filtering on matrix with nested rows
- Subscribe to RSS Feed
- Mark Topic as New
- Mark Topic as Read
- Float this Topic for Current User
- Bookmark
- Subscribe
- Printer Friendly Page
- Mark as New
- Bookmark
- Subscribe
- Mute
- Subscribe to RSS Feed
- Permalink
- Report Inappropriate Content
filtering on matrix with nested rows
Hey guys,
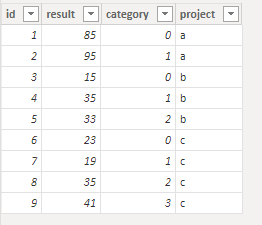
I have following table:
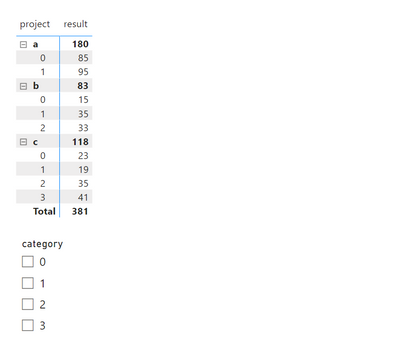
I have a matrix and filter with the following structure:
Now I want to get the following when filtering on category "0" and "2", namely only the records for project "b" and "c" should be visisble.
When I check those filters now I get the following:
But I don't want to see the records/tab for project "a" because there is no record with project "a" and category "2"
Can someone help?
Solved! Go to Solution.
- Mark as New
- Bookmark
- Subscribe
- Mute
- Subscribe to RSS Feed
- Permalink
- Report Inappropriate Content
See if this works for you.
First the model:
Create a measure to use as a filter in the filter pane for the matrix as follows:
FILTER =
VAR DcatRows =
    COUNTROWS ( ALLSELECTED ( DCategory ) )
VAR NotFiltered =
    DISTINCTCOUNT ( 'Table'[project] )
VAR _Rows =
    CALCULATE ( COUNTROWS ( DCategory ), ALL ( 'Table' ) )
RETURN
    IF (
        DcatRows
            = CALCULATE ( COUNT ( 'Table'[project] ), ALLSELECTED ( DCategory[dcategory] ) ),
        1,
        IF ( _Rows <> DcatRows, BLANK (), NotFiltered )
    )
Create the matrix with the rows from the dimension tables, a simple SUM for the values, and add the [FILTER] measure to the filters in the filter pane and set the value to 1:

I've attached the sample PBIX file
Did I answer your question? Mark my post as a solution!
In doing so, you are also helping me. Thank you!
Proud to be a Super User!
Paul on Linkedin.
- Mark as New
- Bookmark
- Subscribe
- Mute
- Subscribe to RSS Feed
- Permalink
- Report Inappropriate Content
See if this works for you.
First the model:
Create a measure to use as a filter in the filter pane for the matrix as follows:
FILTER =
VAR DcatRows =
    COUNTROWS ( ALLSELECTED ( DCategory ) )
VAR NotFiltered =
    DISTINCTCOUNT ( 'Table'[project] )
VAR _Rows =
    CALCULATE ( COUNTROWS ( DCategory ), ALL ( 'Table' ) )
RETURN
    IF (
        DcatRows
            = CALCULATE ( COUNT ( 'Table'[project] ), ALLSELECTED ( DCategory[dcategory] ) ),
        1,
        IF ( _Rows <> DcatRows, BLANK (), NotFiltered )
    )
Create the matrix with the rows from the dimension tables, a simple SUM for the values, and add the [FILTER] measure to the filters in the filter pane and set the value to 1:

I've attached the sample PBIX file
Did I answer your question? Mark my post as a solution!
In doing so, you are also helping me. Thank you!
Proud to be a Super User!
Paul on Linkedin.
- Mark as New
- Bookmark
- Subscribe
- Mute
- Subscribe to RSS Feed
- Permalink
- Report Inappropriate Content
Thank you Paul. This works for me.
One small remark, can I get rid of the Dproject table since it doesn't exist in the filter measure declaration.
- Mark as New
- Bookmark
- Subscribe
- Mute
- Subscribe to RSS Feed
- Permalink
- Report Inappropriate Content
You can in principle, though setting up the model with dimension tables (such as Dproject) is recommended and considered a best practice since it makes the model more efficient.
Did I answer your question? Mark my post as a solution!
In doing so, you are also helping me. Thank you!
Proud to be a Super User!
Paul on Linkedin.
- Mark as New
- Bookmark
- Subscribe
- Mute
- Subscribe to RSS Feed
- Permalink
- Report Inappropriate Content
Hey Paul,
I have only one problem when a project has multiple records with the same category the filter doens't work. This is demonstrated in the screenshot beneath:
Is their a solution for this issue?
- Mark as New
- Bookmark
- Subscribe
- Mute
- Subscribe to RSS Feed
- Permalink
- Report Inappropriate Content
@ThomasBruneel , Try a measure like
measure =
var _cnt = countx(allselected(Category), Category[Category])
return
Sumx(filter(Addcolumns(summarize(Table, [project], [Category]), "_1", [result], "_2", countX(filter(allselected(Table), [project] =max([project])), [Category])), [_2] =_cnt),[_1])
You might have use distinctcount
Helpful resources

Power BI Dataviz World Championships
The Power BI Data Visualization World Championships is back! Get ahead of the game and start preparing now!

| User | Count |
|---|---|
| 39 | |
| 37 | |
| 33 | |
| 32 | |
| 29 |
| User | Count |
|---|---|
| 132 | |
| 88 | |
| 82 | |
| 68 | |
| 64 |


