Join the Fabric User Panel to shape the future of Fabric.
Share feedback directly with Fabric product managers, participate in targeted research studies and influence the Fabric roadmap.
Sign up now- Power BI forums
- Get Help with Power BI
- Desktop
- Service
- Report Server
- Power Query
- Mobile Apps
- Developer
- DAX Commands and Tips
- Custom Visuals Development Discussion
- Health and Life Sciences
- Power BI Spanish forums
- Translated Spanish Desktop
- Training and Consulting
- Instructor Led Training
- Dashboard in a Day for Women, by Women
- Galleries
- Data Stories Gallery
- Themes Gallery
- Contests Gallery
- QuickViz Gallery
- Quick Measures Gallery
- Visual Calculations Gallery
- Notebook Gallery
- Translytical Task Flow Gallery
- TMDL Gallery
- R Script Showcase
- Webinars and Video Gallery
- Ideas
- Custom Visuals Ideas (read-only)
- Issues
- Issues
- Events
- Upcoming Events
Get Fabric certified for FREE! Don't miss your chance! Learn more
- Power BI forums
- Forums
- Get Help with Power BI
- Desktop
- Re: Using a code description rather than codeID
- Subscribe to RSS Feed
- Mark Topic as New
- Mark Topic as Read
- Float this Topic for Current User
- Bookmark
- Subscribe
- Printer Friendly Page
- Mark as New
- Bookmark
- Subscribe
- Mute
- Subscribe to RSS Feed
- Permalink
- Report Inappropriate Content
Using a code description rather than codeID
Hi everyone,
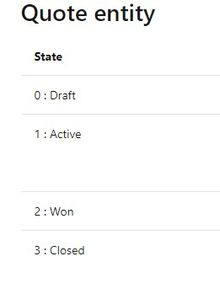
I wonder if someone could clarify for me please. I am using PowerBi to report on some Dynamics data. On a quote entity in dynamics, you have the status e.g Draft, Active, Closed etc.
In my quote entity table, the status is held as the code but in my BI Visuals, the code of course means nothing to end users viewing the data. Is there any way to resolve the code group to the description? Having a chart with headings of 0, 1, 2 etc is meaningless.
Thanks
Solved! Go to Solution.
- Mark as New
- Bookmark
- Subscribe
- Mute
- Subscribe to RSS Feed
- Permalink
- Report Inappropriate Content
Follow on LinkedIn
@ me in replies or I'll lose your thread!!!
Instead of a Kudo, please vote for this idea
Become an expert!: Enterprise DNA
External Tools: MSHGQM
YouTube Channel!: Microsoft Hates Greg
Latest book!: DAX For Humans
DAX is easy, CALCULATE makes DAX hard...
- Mark as New
- Bookmark
- Subscribe
- Mute
- Subscribe to RSS Feed
- Permalink
- Report Inappropriate Content
- Mark as New
- Bookmark
- Subscribe
- Mute
- Subscribe to RSS Feed
- Permalink
- Report Inappropriate Content
Hi, you can have a dim table to the screenshot you put, 2 columns, one is the code, the other is the Status. Create relationship with your dynamic table, and write DAX to display status instead of code. Or add a calculated column to display the Status, up to you.
Helpful resources

Join our Community Sticker Challenge 2026
If you love stickers, then you will definitely want to check out our Community Sticker Challenge!

Power BI Monthly Update - January 2026
Check out the January 2026 Power BI update to learn about new features.

| User | Count |
|---|---|
| 61 | |
| 58 | |
| 45 | |
| 21 | |
| 18 |
| User | Count |
|---|---|
| 120 | |
| 116 | |
| 37 | |
| 34 | |
| 30 |


