FabCon is coming to Atlanta
Join us at FabCon Atlanta from March 16 - 20, 2026, for the ultimate Fabric, Power BI, AI and SQL community-led event. Save $200 with code FABCOMM.
Register now!- Power BI forums
- Get Help with Power BI
- Desktop
- Service
- Report Server
- Power Query
- Mobile Apps
- Developer
- DAX Commands and Tips
- Custom Visuals Development Discussion
- Health and Life Sciences
- Power BI Spanish forums
- Translated Spanish Desktop
- Training and Consulting
- Instructor Led Training
- Dashboard in a Day for Women, by Women
- Galleries
- Data Stories Gallery
- Themes Gallery
- Contests Gallery
- QuickViz Gallery
- Quick Measures Gallery
- Visual Calculations Gallery
- Notebook Gallery
- Translytical Task Flow Gallery
- TMDL Gallery
- R Script Showcase
- Webinars and Video Gallery
- Ideas
- Custom Visuals Ideas (read-only)
- Issues
- Issues
- Events
- Upcoming Events
The Power BI Data Visualization World Championships is back! Get ahead of the game and start preparing now! Learn more
- Power BI forums
- Forums
- Get Help with Power BI
- Desktop
- Re: USERELATIONSHIP needs selection to trigger cor...
- Subscribe to RSS Feed
- Mark Topic as New
- Mark Topic as Read
- Float this Topic for Current User
- Bookmark
- Subscribe
- Printer Friendly Page
- Mark as New
- Bookmark
- Subscribe
- Mute
- Subscribe to RSS Feed
- Permalink
- Report Inappropriate Content
USERELATIONSHIP needs selection to trigger correct calculation of measure? What am I missing?
Hey,
This might be a stupid question, but I seem to have a general misunderstanding when using Measures, Filters and the DAX USERELATIONSHIP function.
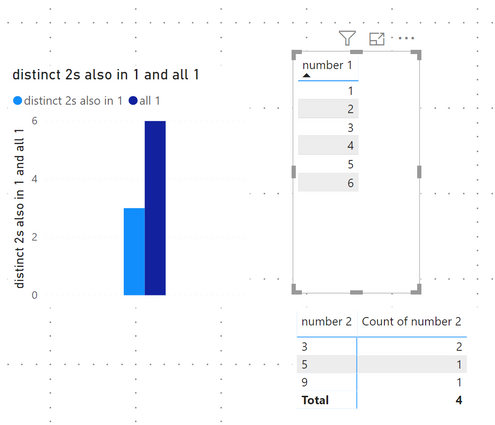
I seems to work just fine for my dataset, but I always need to make a selection thus filter the data for which it then evaluates the measure using USERELATIONSHIP correctly. If I unselect everything it seems to ignore the USERELATIONSHIP calculation and gives the results without it.
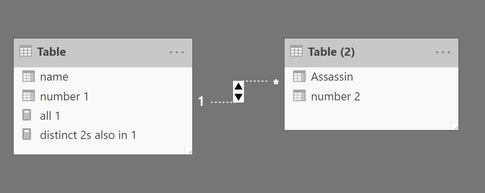
I just have 2 tables with an inactive relationship:
My measure is showing distinct values as such:
It is counting the number 2 value '9' which is not in Table 1.
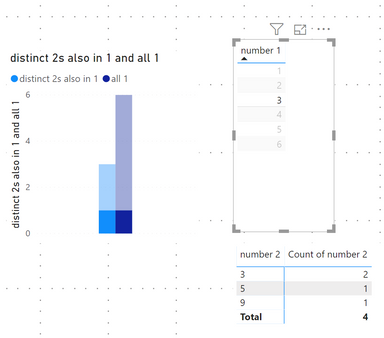
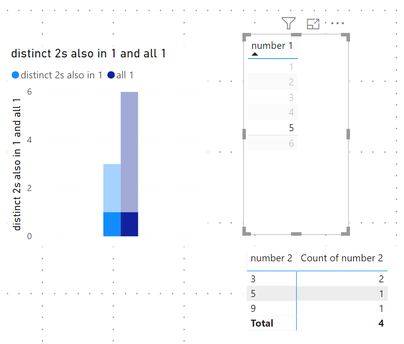
If I make a selection in the number 1 table it shows the values correctly as only '1'
How can I get the result of '2' for my measure posted above that works without a selection?
I uploaded a very simple pbix file to show what I mean.
Thanks for your help.
- Mark as New
- Bookmark
- Subscribe
- Mute
- Subscribe to RSS Feed
- Permalink
- Report Inappropriate Content
Hi @systemic_till ,
You can add write measure to calculate table2 records with if statement to compare current row contents with tbale1 records:
Measure =
IF (
    SELECTEDVALUE ( 'Table (2)'[number 2] ) IN VALUES ( 'Table'[number 1] ),
    CALCULATE (
        COUNT ( 'Table (2)'[number 2] ),
        USERELATIONSHIP ( 'Table'[number 1], 'Table (2)'[number 2] )
    )
)
If above not help, please explain your requirement more clarify with the expected result.
Regards,
Xiaoxin Sheng
- Mark as New
- Bookmark
- Subscribe
- Mute
- Subscribe to RSS Feed
- Permalink
- Report Inappropriate Content
Hi @v-pn ,
Thanks for you answer.
It didn't clarify my issue though.
In my setup, everything works as expected, if I make a selection.
Only when nothing is selected I am getting confusing results.
My expected result is 2, when nothing is selected.
Yet, I get a result of 3 as if the USERELATIONSHIP filter was missing entirely.
So, to clarify:
// Measure 1
no relationship = CALCULATE (DISTINCTCOUNT('Table (2)'[number 2])
==> that gives 3. That's ok.
//Measure 2
distinct 2s also in 1 =
==> that also gives 3 when no selection is made. Why is it not 2?
Helpful resources

Power BI Dataviz World Championships
The Power BI Data Visualization World Championships is back! Get ahead of the game and start preparing now!

| User | Count |
|---|---|
| 39 | |
| 35 | |
| 34 | |
| 32 | |
| 27 |
| User | Count |
|---|---|
| 136 | |
| 96 | |
| 77 | |
| 67 | |
| 65 |


