This is best Fabric, Power BI, SQL and AI community event. How do we know? The last event sold out! Save €200 with code FABCMTY200.
Register nowThe Fabric community is upgrading! Read all of the details including the timeline and what you can expect. Learn more
Hi,
I want to display the data in the following way: -
1. Each day of the week gives me the summary for the week.
Let's take Monday. I have a measure and Time Hierarchy (Year, Months, Days). Now, is it possible to have the data only displayed for Jan 2, Jan 9, Jan 16, Jan 23 and so on without manually choosing the those days in the filter? I mean every time the data is refreshed in the cube I should be able to see only the data for every monday automatically updated. (Assume gateway is setup and working fine)
So if I open the report in march, it should have the data for every monday starting Jan 2 without me choosing those days in the filter.
Is it possible?
Solved! Go to Solution.
Hi @Anonymous,
There are 2 common approaches that you could try:
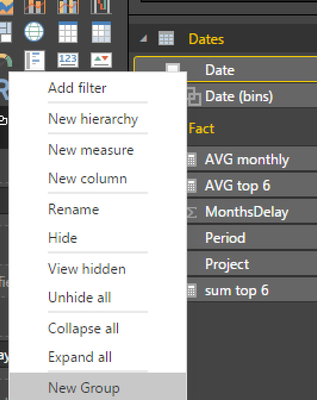
right click in your date column and choose new group
choose duration 7 days
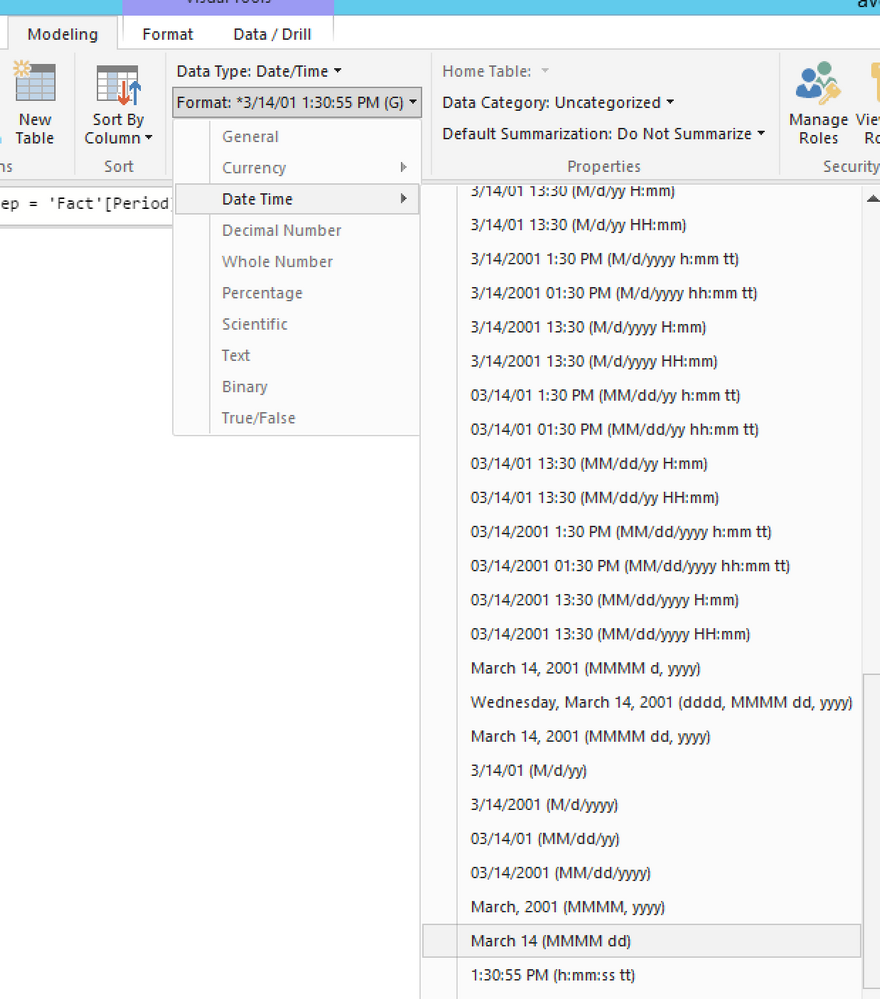
Weeks Rep = 'Fact'[DateColumn]- WEEKDAY('Fact'[DateColumn]-2)please change this column format in Formatting tab of Modeling tab to what format you want
Hi @Anonymous,
There are 2 common approaches that you could try:
right click in your date column and choose new group
choose duration 7 days
Weeks Rep = 'Fact'[DateColumn]- WEEKDAY('Fact'[DateColumn]-2)please change this column format in Formatting tab of Modeling tab to what format you want
Can we do the same on Live Connection?
Join us in Barcelona for FabCon and SQLCon, the Fabric, Power BI, SQL, and AI community event. Save €200 with code FABCMTY200.
| User | Count |
|---|---|
| 24 | |
| 22 | |
| 20 | |
| 18 | |
| 14 |
| User | Count |
|---|---|
| 31 | |
| 26 | |
| 23 | |
| 20 | |
| 20 |