cancel
Showing results for 
Search instead for 
Did you mean: 

July 7 - July 17 | Round 2 of the Power BI Dataviz World Championships. Don't miss your chance! Learn more

Reply
eagletro
Frequent Visitor

Stock Movement graph

Hi,


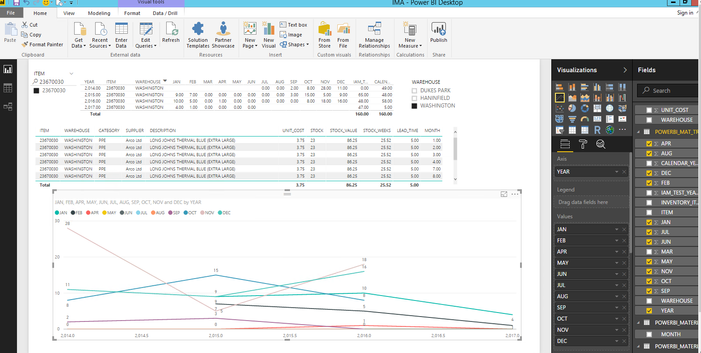
i am trying to graph the below. i  just want each year as a line showing the values for the item number 23670030 by month.

data graph.PNG

i can achieve the below in excel.. each series is a year.. sorry rushed it 🙂

graphexcel.png


but the best i can achieve in power bi so far is..


graph.PNG


any help will greatly appreciated.


Robert

1 ACCEPTED SOLUTION
v-ljerr-msft
Microsoft Employee
Microsoft Employee

Hi @eagletro,


According to your description above, you may need to use Unpivot option under Query Editor > Transform to unpivot your "JAN", "FEB" ... "DEC" columns to a column with all months, and a column with all values of each month. 


Then you should be able to use the unpivoted Month column as Axis, the YEAR column as Legend, and the Value column as Values on the Line chart to get your expected result.


For more details about how use Unpivot option with Power BI, you can refer to this article. Smiley Happy


Regards

View solution in original post

2 REPLIES 2
v-ljerr-msft
Microsoft Employee
Microsoft Employee

Hi @eagletro,


According to your description above, you may need to use Unpivot option under Query Editor > Transform to unpivot your "JAN", "FEB" ... "DEC" columns to a column with all months, and a column with all values of each month. 


Then you should be able to use the unpivoted Month column as Axis, the YEAR column as Legend, and the Value column as Values on the Line chart to get your expected result.


For more details about how use Unpivot option with Power BI, you can refer to this article. Smiley Happy


Regards

prakash_gautam
Resolver II
Resolver II

Hello,


What about Year in Legend, Month in Axis and the measure in Values as in the following screen:


line-graph.png

Thanks,

Helpful resources

Announcements
FabCon and SQLCon Barcelona 2026

FabCon & SQLCon – Barcelona 2026

Join us in Barcelona for FabCon and SQLCon, the Fabric, Power BI, SQL, and AI community event. Save €200 with code FABCMTY200.

60 days of Data Days Carousel

Data Days 2026

Join Fabric Data Days 2026: 60 days of free live/on-demand sessions, challenges, study groups, and certification opportunities.

Power BI DataViz World Championships carousel

Power BI DataViz World Championships - June 2026

A new Power BI DataViz World Championship is coming this June! Don't miss out on submitting your entry.

Top Solution Authors