cancel
Showing results for 
Search instead for 
Did you mean: 

July 7 - July 17 | Round 2 of the Power BI Dataviz World Championships. Don't miss your chance! Learn more

Reply
newgirl
Post Patron
Post Patron

Specific Rows to Have Different Data Type

Hi! 


I was assigned to make a simple table in PBI showing the values provided by the department. Here is a sample layout of the raw data.


KEI/KPITypeSegmentJan-21Feb-21Mar-21Apr-21May-21Jun-21Jul-21Aug-21Sep-21Oct-21Nov-21Dec-21
KPI1BulkBuilders100%100%100%100%        
KPI1BulkDistributor100%100%100%100%        
KPI1BulkIndustrial100%100%100%100%        
KPI1BagBuilders100%99%100%99%        
KPI1BagDistributor100%99%99%97%        
KPI1BagIndustrial95%96%99%79%        
KPI2BulkBuilders99%99%100%99%        
KPI2BulkDistributor100%100%100%100%        
KPI2BulkIndustrial99%99%100%100%        
KPI2BagBuilders97%93%96%88%        
KPI2BagDistributor95%95%96%87%        
KPI2BagIndustrial95%99%95%97%        
KPI3BulkAll3893108116        
KPI3BulkAll9431        
KPI3BagAll785704784779        
KPI3BagAll7659449       


As you can see, the numbers are mostly presented in % except for the KPI3 in which it should be presented in absolute numbers.


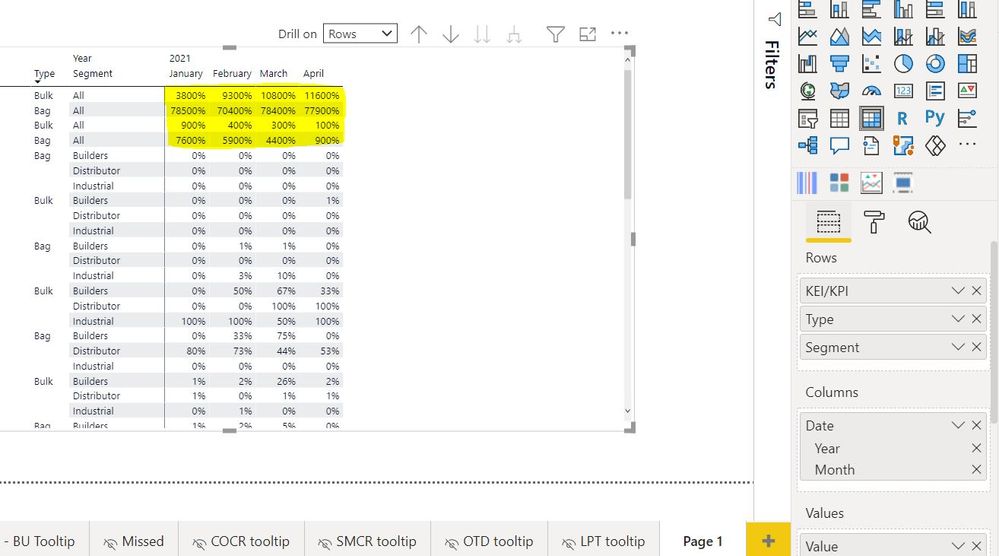
In my inital process, I used 'unpivoted' and so all values are now in one column and I added a column to have a date column.

Here is my output. My question is that is there a way for these values (highlighted in yellow) to show as absolute while the rest are in percentages?


values1.JPG

1 ACCEPTED SOLUTION
Jihwan_Kim
Super User
Super User

Hi, @newgirl 

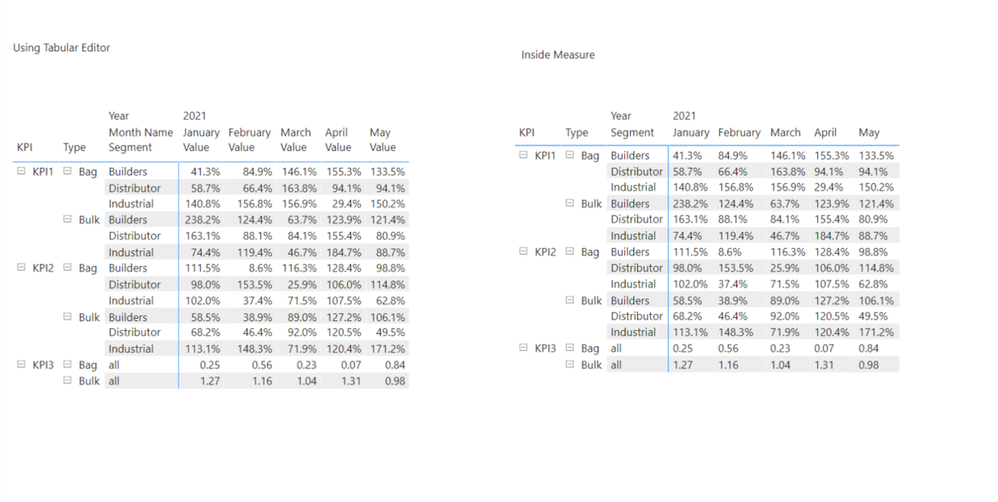
Please check the below picture and the sample pbix file's link down below.

I tried to create a sample based on the explanation.

There are many ways to achieve this, but I suggest two ways like below.


Picture2.png


All measures are in the sample pbix file.


https://www.dropbox.com/s/tdnfq3fk307d5nc/newgirl.pbix?dl=0 


Hi, My name is Jihwan Kim.


If this post helps, then please consider accept it as the solution to help other members find it faster, and give a big thumbs up.


Linkedin: linkedin.com/in/jihwankim1975/

Twitter: twitter.com/Jihwan_JHKIM


If this post helps, then please consider accepting it as the solution to help other members find it faster, and give a big thumbs up.


Click here to visit my LinkedIn page

View solution in original post

2 REPLIES 2
Jihwan_Kim
Super User
Super User

Hi, @newgirl 

Please check the below picture and the sample pbix file's link down below.

I tried to create a sample based on the explanation.

There are many ways to achieve this, but I suggest two ways like below.


Picture2.png


All measures are in the sample pbix file.


https://www.dropbox.com/s/tdnfq3fk307d5nc/newgirl.pbix?dl=0 


Hi, My name is Jihwan Kim.


If this post helps, then please consider accept it as the solution to help other members find it faster, and give a big thumbs up.


Linkedin: linkedin.com/in/jihwankim1975/

Twitter: twitter.com/Jihwan_JHKIM


If this post helps, then please consider accepting it as the solution to help other members find it faster, and give a big thumbs up.


Click here to visit my LinkedIn page

Hello! I did the measure approach and it worked. Thank you so much!

Helpful resources

Announcements
FabCon and SQLCon Barcelona 2026

FabCon & SQLCon – Barcelona 2026

Join us in Barcelona for FabCon and SQLCon, the Fabric, Power BI, SQL, and AI community event. Save €200 with code FABCMTY200.

60 days of Data Days Carousel

Data Days 2026

Join Fabric Data Days 2026: 60 days of free live/on-demand sessions, challenges, study groups, and certification opportunities.

Power BI DataViz World Championships carousel

Power BI DataViz World Championships - June 2026

A new Power BI DataViz World Championship is coming this June! Don't miss out on submitting your entry.