This is best Fabric, Power BI, SQL and AI community event. How do we know? The last event sold out! Save €200 with code FABCMTY200.
Register nowThe Fabric community is upgrading! Read all of the details including the timeline and what you can expect. Learn more
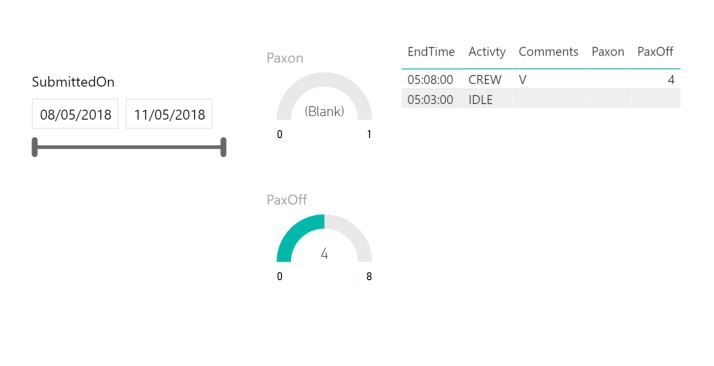
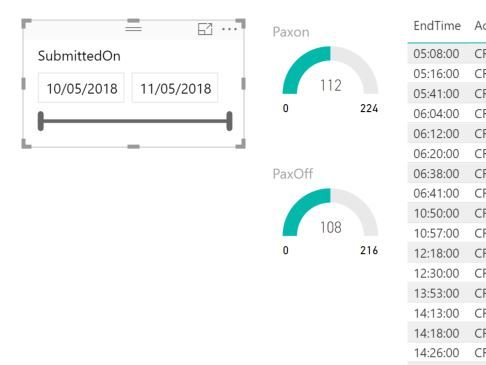
I have a slicer on my visual and i cant understadn why it's not working.
My understanding is that when i adjust the slicer to the date range i need it should filter the linked data / visuals to show data in that range.
In this example the data entries are on the 10th and by defualt the data is displayed correctly. when i extend the date range the data reduceses. i woul dhave though that any range the slicer is adjusted to will disply the data included within that range.
can anyone point me in the right direction as i can see what i am doing wrong here
you can see the slicer bar didn't adapt, generally you should try to confirm the date by pressing enter and clicking to another graph.
it's not user friendly but works!
Thanks but i have tried that and it didnt solve the issues. i tried to manualy move the slider and it would not work?
As a test, maybe you could create a duplicate column but change the format of the date/time and then try a slicer on that? I'm just wondering of PBI is having an issue with format. Just a thought.
Join us in Barcelona for FabCon and SQLCon, the Fabric, Power BI, SQL, and AI community event. Save €200 with code FABCMTY200.
| User | Count |
|---|---|
| 27 | |
| 22 | |
| 20 | |
| 18 | |
| 14 |
| User | Count |
|---|---|
| 25 | |
| 20 | |
| 20 | |
| 20 | |
| 20 |