This is best Fabric, Power BI, SQL and AI community event. How do we know? The last event sold out! Save €200 with code FABCMTY200.
Register nowThe Fabric community is upgrading! Read all of the details including the timeline and what you can expect. Learn more
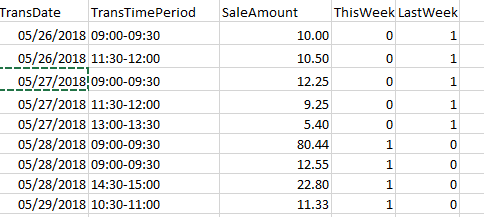
Hello... I'll simplify this by having only five columns within the SalesTransaction table:
TransDate (eg. 05/29/2018)
TransTimePeriod (eg. 06:30-07:00)
SaleAmount (eg. 200.00)
ThisWeek ( measure where = 1 when True)
LastWeek (measure where= 1 when True)
I also have a Date table.
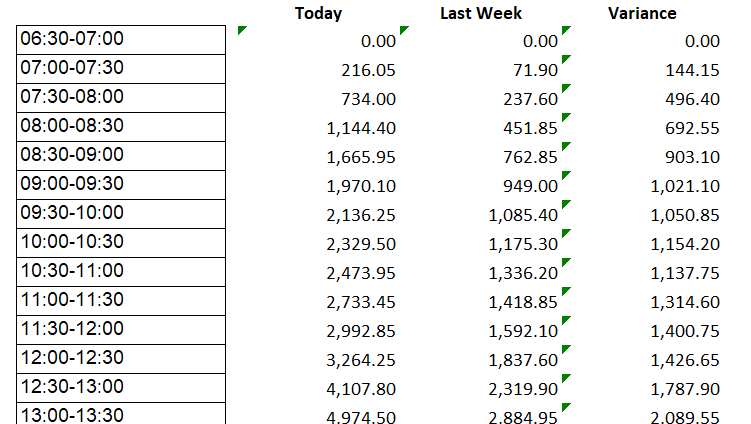
I want to create a visual that shows the following:
Essentially I need to summarize the SaleAmount for each TransTimePeriod (easy so far), and then compare it for the same period last week (which is where I'm getting stuck).
Working solution! THX!
Here is a simplified example of the SalesTransaction table (it's a whole lot more sophisticated but this will do):
Date file is just a list of dates.
Hi @finzilla,
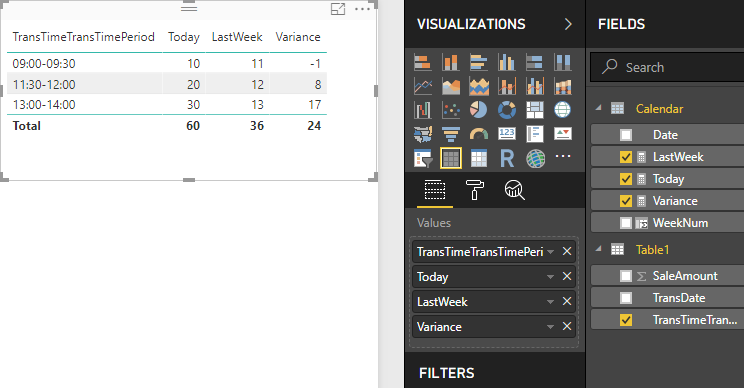
Please check the demo in the attachment.
1. I would suggest adding a column in the date table.
WeekNum = WEEKNUM([Date],2)
2. Create three measures.
Today = CALCULATE ( SUM ( Table1[SaleAmount] ), 'Calendar'[Date] = TODAY () )
LastWeek =
CALCULATE (
SUM ( Table1[SaleAmount] ),
'Calendar'[WeekNum]
= WEEKNUM ( TODAY (), 2 ) - 1
)
Variance = [Today] - [LastWeek]
Best Regards,
Dale
Join us in Barcelona for FabCon and SQLCon, the Fabric, Power BI, SQL, and AI community event. Save €200 with code FABCMTY200.
| User | Count |
|---|---|
| 27 | |
| 22 | |
| 20 | |
| 18 | |
| 14 |
| User | Count |
|---|---|
| 25 | |
| 20 | |
| 20 | |
| 20 | |
| 20 |