Get certified for free when you join Fabric Data Days 2026 and dive into Fabric, Power BI, SQL, AI, and other essential data skills.
Join nowJuly 7 - July 17 | Round 2 of the Power BI Dataviz World Championships. Don't miss your chance! Learn more
Hi,
I am trying to create a stacked graph of a running total, but I am having great problems.
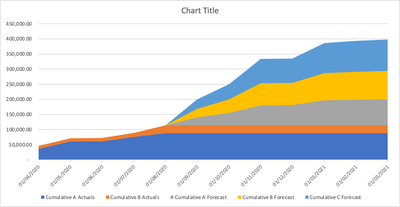
What i am trying to get is a graph like this:
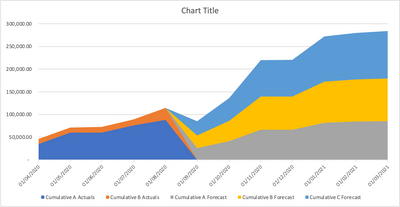
but i am getting this:
I have a sample PBIX file here:
Grateful if someone can help me please
Solved! Go to Solution.
Hi @timknox ,
Please try this:
Create a new date table:
Date = CALENDARAUTO()
Create a measure:
Running Total =
CALCULATE(
SUM(Sheet1[Value]),FILTER(ALL('Date'),'Date'[Date]<=MAX('Date'[Date])))
@timknox , try a measure like
CALCULATE(
SUM(Sheet1[Value]),FILTER(ALL(Sheet1),Sheet1[Date]<=MAX(Sheet1[Date])))
In case you want all only date. Move that to a separate table or use date table
CALCULATE(
SUM(Sheet1[Value]),FILTER(ALL(DAte),DAte[Date]<=MAX(DAte[Date])))
Hi @timknox ,
Please try this:
Create a new date table:
Date = CALENDARAUTO()
Create a measure:
Running Total =
CALCULATE(
SUM(Sheet1[Value]),FILTER(ALL('Date'),'Date'[Date]<=MAX('Date'[Date])))
Join us in Barcelona for FabCon and SQLCon, the Fabric, Power BI, SQL, and AI community event. Save €200 with code FABCMTY200.
If you love stickers, then you will definitely want to check out our community sticker challenge, Barcelona edition!
Check out the July 2026 Power BI update to learn about new features.
| User | Count |
|---|---|
| 29 | |
| 23 | |
| 23 | |
| 22 | |
| 14 |
| User | Count |
|---|---|
| 48 | |
| 33 | |
| 20 | |
| 18 | |
| 16 |