This is best Fabric, Power BI, SQL and AI community event. How do we know? The last event sold out! Save €200 with code FABCMTY200.
Register nowThe Fabric community is upgrading! Read all of the details including the timeline and what you can expect. Learn more
Hi,
I'm trying to run the example below from Power Bi, however I'm getting the following error:
import pandas as pd
data = [['Alex',10],['Bob',12],['Clarke',13]]
df = pd.DataFrame(data,columns=['Name','Age'],dtype=float)
print (df)
Can anyone help please? I have the python scripting enabled in Power BI and packages installed
thanks!
Solved! Go to Solution.
@LauraBueno , Reinstall numpy. make sure you use PIP install
check the description of this video for various command and error solution links
https://www.youtube.com/watch?v=5D0BkNsu5CM
@LauraBueno , Reinstall numpy. make sure you use PIP install
check the description of this video for various command and error solution links
Hi @amitchandak ,
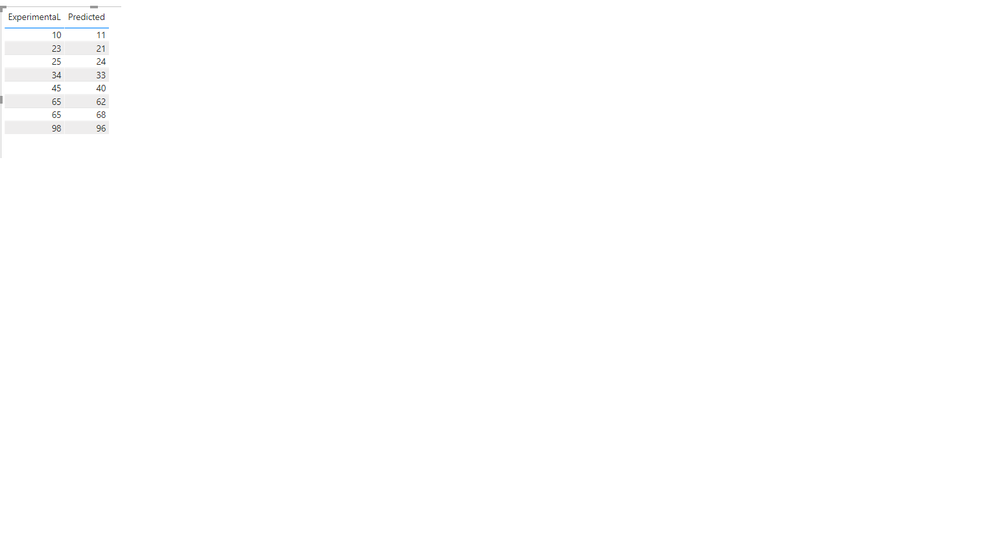
I'm now trying to create a scatter plot with python for two numeric arrays: Experimental and Predicted as shown below.
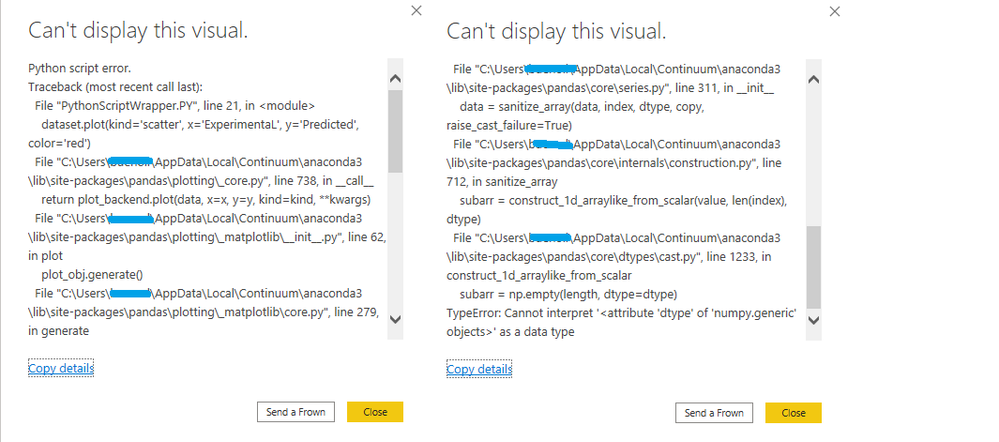
However I get the following error:
Any help would be really appreciated!
Thank you
Join us in Barcelona for FabCon and SQLCon, the Fabric, Power BI, SQL, and AI community event. Save €200 with code FABCMTY200.
| User | Count |
|---|---|
| 27 | |
| 22 | |
| 20 | |
| 18 | |
| 14 |
| User | Count |
|---|---|
| 25 | |
| 20 | |
| 20 | |
| 20 | |
| 20 |