This is best Fabric, Power BI, SQL and AI community event. How do we know? The last event sold out! Save €200 with code FABCMTY200.
Register nowThe Fabric community is upgrading! Read all of the details including the timeline and what you can expect. Learn more
I am trying to create a new column ("pct_change") within an existing dataframe that was imported from SQLServer.
The following code worked in R Studio:
library(dplyr)
df1 <- df1 %>%
group_by(employeeid) %>%
arrange(fiscalyear, .by_group = TRUE) %>%
mutate(pct_change = ((Salary/lag(Salary) - 1) * 100))
I then modified the above code from "df1" to "dataset" but was unable to get it to work. Could someone please help me?
Solved! Go to Solution.
Hi @Anonymous ,
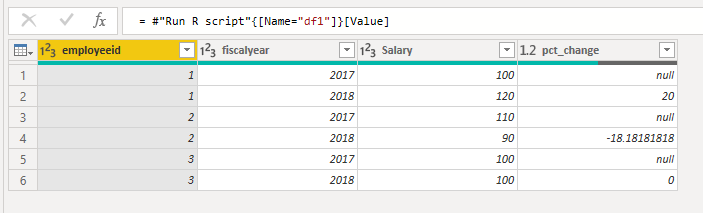
I use the code below and new column is created.
library(stats) library(base) library(dplyr) df1 <- dataset %>% group_by(employeeid) %>% arrange(fiscalyear, .by_group = TRUE) %>% mutate(pct_change = ((Salary/lag(Salary) - 1) * 100))
Best Regards,
Icey
If this post helps, then please consider Accept it as the solution to help the other members find it more quickly.
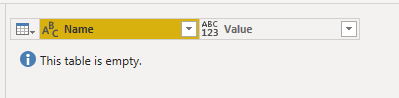
I'm just getting a blank table.
Hi @Anonymous ,
I use the code below and new column is created.
library(stats) library(base) library(dplyr) df1 <- dataset %>% group_by(employeeid) %>% arrange(fiscalyear, .by_group = TRUE) %>% mutate(pct_change = ((Salary/lag(Salary) - 1) * 100))
Best Regards,
Icey
If this post helps, then please consider Accept it as the solution to help the other members find it more quickly.
How and where did you save that code block within Power BI?
Thanks, Icey! I didn't realize you had to import R base and stats.
Hi @Anonymous ,
Can you give me your error information? So that I can help you better.
Best Regards,
Icey
Join us in Barcelona for FabCon and SQLCon, the Fabric, Power BI, SQL, and AI community event. Save €200 with code FABCMTY200.
| User | Count |
|---|---|
| 24 | |
| 22 | |
| 20 | |
| 18 | |
| 14 |
| User | Count |
|---|---|
| 27 | |
| 22 | |
| 21 | |
| 20 | |
| 20 |