cancel
Showing results for 
Search instead for 
Did you mean: 

July 28 - August 9 | Final Round of the Power BI Dataviz World Championships. This is your chance. Learn more

Reply
Anonymous
Not applicable

Ranking multiple columns

Hi Power BI community. I am relatively new to Power BI so bear with me. 


I have a table of data where each row represents a production run on a specific by a specific team on a specific model etc. There are many different defects that can occur and they are each respresented with a column in the table. For example, a production run on 9/9/19 could have a value of 200 in the 'Input' column, a value of 2 in the 'Defect 1' column, and a value of 10 in the 'Defect 7' column. The rest of the Defect columns in that row would have a value of zero in them.


I have a visual that shows the frequency that each specific defect occurs according to a date hierarchy. Say there are 10 defects. I would like to be able to make the visual only show the top three defects for a specific date range determined by a slicer.


I have looked into this and could only find information relating to the RANKX function which ranks values in a column. Since I need to rank actual columns by their sum this was not helpful to me. 


1 ACCEPTED SOLUTION
jdbuchanan71
Super User
Super User

Hello @Anonymous 

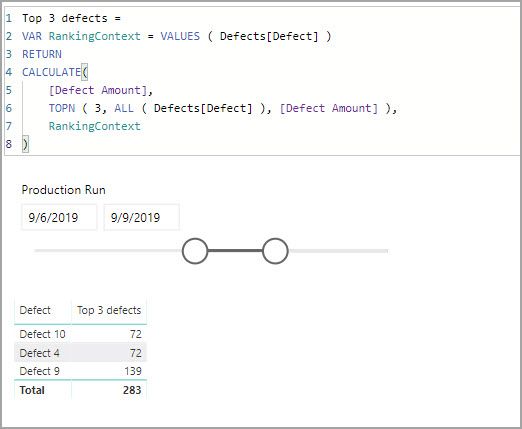
The only way I know of to do what you are looking for is to unpivot the defects informatoin so you end up with 2 columns, defect type and value.  Then you can do the ranking on the value column.

Top 3 defects = 
VAR RankingContext = VALUES ( Defects[Defect] )
RETURN
CALCULATE(
    [Defect Amount],
    TOPN ( 3, ALL ( Defects[Defect] ), [Defect Amount] ),
    RankingContext
)

Top3Defects.jpg

I have attached my sample file for you to look at.

View solution in original post

1 REPLY 1
jdbuchanan71
Super User
Super User

Hello @Anonymous 

The only way I know of to do what you are looking for is to unpivot the defects informatoin so you end up with 2 columns, defect type and value.  Then you can do the ranking on the value column.

Top 3 defects = 
VAR RankingContext = VALUES ( Defects[Defect] )
RETURN
CALCULATE(
    [Defect Amount],
    TOPN ( 3, ALL ( Defects[Defect] ), [Defect Amount] ),
    RankingContext
)

Top3Defects.jpg

I have attached my sample file for you to look at.

Helpful resources

Announcements
FabCon and SQLCon Barcelona 2026

FabCon & SQLCon – Barcelona 2026

Join us in Barcelona for FabCon and SQLCon, the Fabric, Power BI, SQL, and AI community event. Save €200 with code FABCMTY200.

Fabric Community Sticker Design Challenge Barcelona Carousel

Fabric Community Sticker Challenge - Barcelona 2026

If you love stickers, then you will definitely want to check out our community sticker challenge, Barcelona edition!

July Power BI Update Carousel

Power BI Monthly Update - July 2026

Check out the July 2026 Power BI update to learn about new features.

Power BI DataViz World Championships carousel

Power BI DataViz World Championships - June 2026

A new Power BI DataViz World Championship is coming this June! Don't miss out on submitting your entry.