Get certified for free when you join Fabric Data Days 2026 and dive into Fabric, Power BI, SQL, AI, and other essential data skills.
Join nowJuly 28 - August 9 | Final Round of the Power BI Dataviz World Championships. This is your chance. Learn more
Hey Guys,
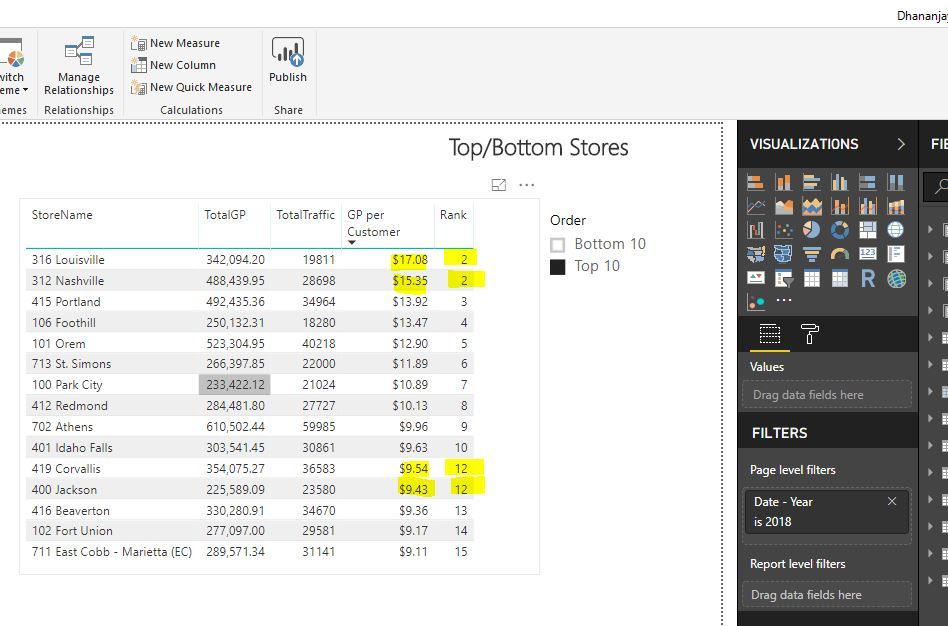
I have created a Rank function with a Top/Bottom filter. It's working, but it is acting kinda weird. Please see the attached image does anybody know why is that or what's wrong? It's showing the same rank even though they are not the same numbers that we rank by.
Equation -
Rank = IF(
HASONEVALUE('Top/Bottom'[Order]),
SWITCH(
VALUES('Top/Bottom'[Order]),
"Top 10", RANKX(ALL(Store_dim[StoreName]),[GP per Customer],,DESC,Dense),
RANKX(ALL(Store_dim[StoreName]),[GP per Customer],,ASC,Dense)
))This is a very large file. I try to upload a sample file but it did not work. Sorry about that.
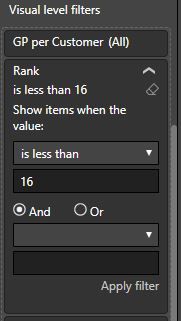
One more thing, when I filter by Rank is less than 16, that is when my chart get weird
Thank you so much
Solved! Go to Solution.
Hi @Anonymous,
Please modify the formula to below for a test.
Rank = IF(
HASONEVALUE('Top/Bottom'[Order]),
SWITCH(
VALUES('Top/Bottom'[Order]),
"Top 10", RANKX(ALLSELECTED(Store_dim),[GP per Customer],,DESC,Dense),
RANKX(ALLSELECTED(Store_dim),[GP per Customer],,ASC,Dense)
))
Regards,
Yuliana Gu
Hi @Anonymous,
Please modify the formula to below for a test.
Rank = IF(
HASONEVALUE('Top/Bottom'[Order]),
SWITCH(
VALUES('Top/Bottom'[Order]),
"Top 10", RANKX(ALLSELECTED(Store_dim),[GP per Customer],,DESC,Dense),
RANKX(ALLSELECTED(Store_dim),[GP per Customer],,ASC,Dense)
))
Regards,
Yuliana Gu
If you love stickers, then you will definitely want to check out our community sticker challenge, Barcelona edition!
Check out the July 2026 Power BI update to learn about new features.
| User | Count |
|---|---|
| 28 | |
| 28 | |
| 19 | |
| 19 | |
| 19 |
| User | Count |
|---|---|
| 37 | |
| 29 | |
| 18 | |
| 17 | |
| 15 |