Get certified for free when you join Fabric Data Days 2026 and dive into Fabric, Power BI, SQL, AI, and other essential data skills.
Join nowJuly 7 - July 17 | Round 2 of the Power BI Dataviz World Championships. Don't miss your chance! Learn more
Hi there,
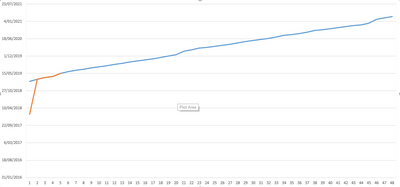
I'm trying to create a project tracking chart, whihc is basically a project managemnet S curve.
The only difference is my X axis is date (so continuous variable) and my Y axis are the different projects - 48 different sprints - (so a categorical variable).
I was able to do it in excel (picture below), and I'm trying ot accomnplish this in power BI.
Please help.
Cheers
Solved! Go to Solution.
Hi @Anonymous
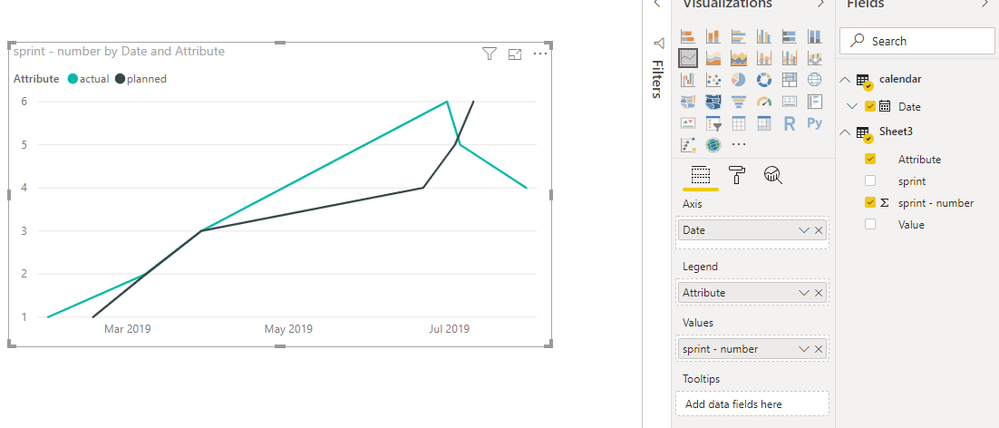
Line chart doesn't support to use "date" in the y-axis.
One workaround is as below:
Open Edit queries,
Click on "sprint" column, then select add column- duplicates column,
Click on the duplicated column, then select transform->split column,
Select "planned" and "actual" columns, then select transform->unpivot columns,
Close && apply,
Create another table and connnect it with original table
calendar = CALENDARAUTO()
Best Regards
Maggie
Community Support Team _ Maggie Li
If this post helps, then please consider Accept it as the solution to help the other members find it more quickly.
Hi @Anonymous
Another workaround is to create a R visual so that the date field can be used in Y axis.
After transformation as my previous post, create a r visual as below:
https://community.powerbi.com/t5/Desktop/dates-on-Y-axis/td-p/339940
Best Regards
Maggie
Community Support Team _ Maggie Li
If this post helps, then please consider Accept it as the solution to help the other members find it more quickly.
Hi @Anonymous
Line chart doesn't support to use "date" in the y-axis.
One workaround is as below:
Open Edit queries,
Click on "sprint" column, then select add column- duplicates column,
Click on the duplicated column, then select transform->split column,
Select "planned" and "actual" columns, then select transform->unpivot columns,
Close && apply,
Create another table and connnect it with original table
calendar = CALENDARAUTO()
Best Regards
Maggie
Community Support Team _ Maggie Li
If this post helps, then please consider Accept it as the solution to help the other members find it more quickly.
Hi @Anonymous ,
Sounds pretty straight forward, where did you get stuck?
Reg,
Robin
Hi Robin,
I've added a screenshot of the data I'm trying to visualise in power BI.
As you can see, the sprint data is on the x axis and is categorical and the y axis is the date the sprint is completed (there will be 2 trendlines, planned finish vs actual finish).
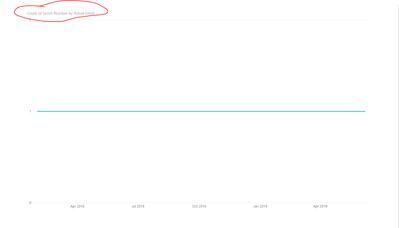
This is what I'm getting in Power BI.
As you can see, it's trying to count the sprints, but I need the sprints to be discrete.
Hope this provides more clarification.
Cheers.
Join us in Barcelona for FabCon and SQLCon, the Fabric, Power BI, SQL, and AI community event. Save €200 with code FABCMTY200.
Join Data Days 2026: 60 days of free live/on-demand sessions, challenges, study groups, and certification opportunities.
| User | Count |
|---|---|
| 29 | |
| 23 | |
| 18 | |
| 18 | |
| 15 |
| User | Count |
|---|---|
| 50 | |
| 44 | |
| 43 | |
| 39 | |
| 33 |