Join us in Barcelona for FabCon and SQLCon, September 28 - October 1, 2026.
This is best Fabric, Power BI, SQL and AI community event. How do we know? The last event sold out! Save €200 with code FABCMTY200.
Register now- Power BI forums
- Get Help with Power BI
- Desktop
- Service
- Report Server
- Power Query
- Mobile Apps
- Developer
- DAX Commands and Tips
- Custom Visuals Development Discussion
- Health and Life Sciences
- Power BI Spanish forums
- Translated Spanish Desktop
- Training and Consulting
- Instructor Led Training
- Dashboard in a Day for Women, by Women
- Galleries
- Data Stories Gallery
- Themes Gallery
- Contests Gallery
- QuickViz Gallery
- Quick Measures Gallery
- Visual Calculations Gallery
- Fabric Apps Gallery
- Notebook Gallery
- Translytical Task Flow Gallery
- TMDL Gallery
- R Script Showcase
- Webinars and Video Gallery
- Ideas
- Custom Visuals Ideas (read-only)
- Issues
- Issues
- Events
- Upcoming Events
The Fabric community is now in read-only for platform upgrade. Learn more
- Power BI forums
- Forums
- Get Help with Power BI
- Desktop
- Re: Offsetting Calculated Column Rows
- Subscribe to RSS Feed
- Mark Topic as New
- Mark Topic as Read
- Float this Topic for Current User
- Bookmark
- Subscribe
- Printer Friendly Page

- Mark as New
- Bookmark
- Subscribe
- Mute
- Subscribe to RSS Feed
- Permalink
Offsetting Calculated Column Rows
Hi guys,
I'm having a bit of a dilemma with generating a Calculated Column in DAX, the goal is to calculate Cal_charge+Amt column from the Excel table above. As you can see, the data on that column is exactly the same numbers as Sum of chargeAmt except that it's offset by 2 months behind. I have no idea where to begin to be able to generate that new column and make the first 2 rows blank like that. I need that column in order to generate Cash Factor. I'm new to the Power BI and DAX world so I would appreciate the help.
Solved! Go to Solution.


- Mark as New
- Bookmark
- Subscribe
- Mute
- Subscribe to RSS Feed
- Permalink
Try this calculated column
Cal_charge+Amt =
VAR temp =
    TOPN (
        2,
        FILTER ( Table3, [Month-Year] < EARLIER ( [Month-Year] ) ),
        [Month-Year], DESC
    )
VAR temp1 =
    TOPN ( 1, temp, [Month-Year], ASC )
RETURN
    IF ( COUNTROWS ( temp ) = 2, MINX ( temp1, [Sum of ChargeAmt] ) )
Regards
Zubair
Please try my custom visuals
- Mark as New
- Bookmark
- Subscribe
- Mute
- Subscribe to RSS Feed
- Permalink
When I use it with a sample table it works
Please see Power Pivot model in attached Excel Workbook
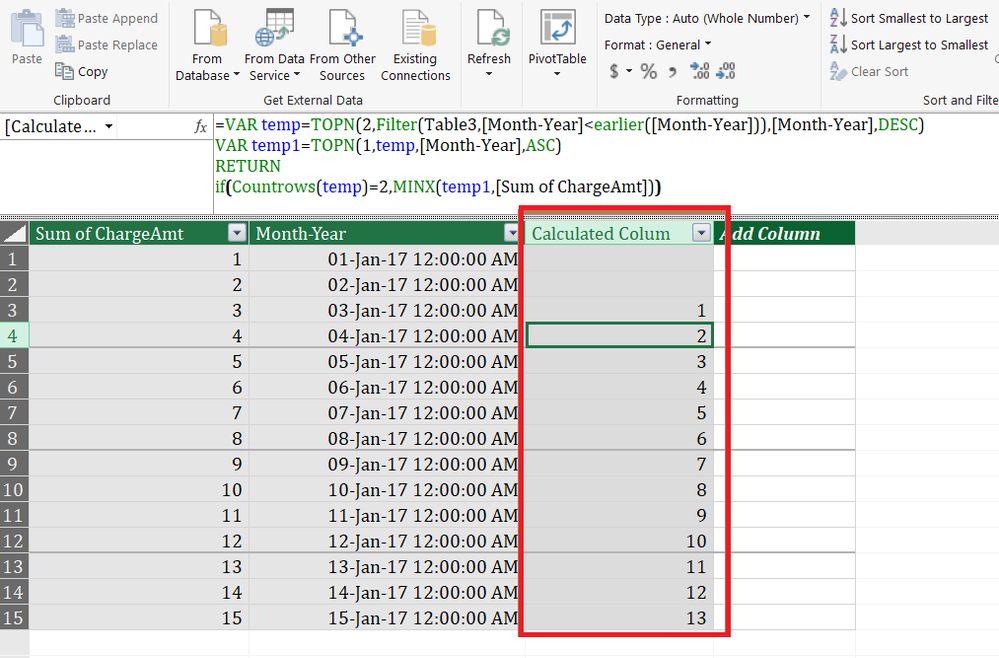
Regards
Zubair
Please try my custom visuals


- Mark as New
- Bookmark
- Subscribe
- Mute
- Subscribe to RSS Feed
- Permalink
Hi @ccueto36,
Based on my test, I have tried what Zubair suggested, it could work on my side, and you could also refer to my step:
Sample data:
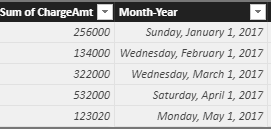
Create a calculated column:
Column 2 = var a=MONTH('Table3'[Month-Year])-2
return CALCULATE(SUM(Table3[Sum of ChargeAmt]),FILTER('Table3',MONTH('Table3'[Month-Year])=a))
Result(Column1 is the Zubair's function):
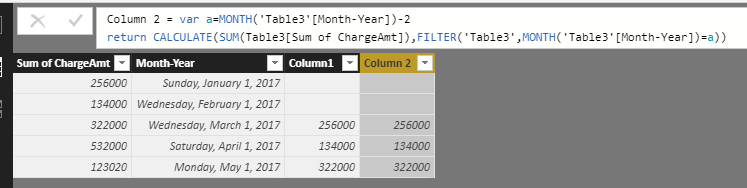
You could also download the pbix to have a view, if it still could not work, could you please share the pbix if possible?
https://www.dropbox.com/s/jjdh69fw2ipjbr4/Offsetting%20Calculated%20Column%20Rows.pbix?dl=0
Regards,
Daniel He
If this post helps, then please consider Accept it as the solution to help the other members find it more quickly.
- Mark as New
- Bookmark
- Subscribe
- Mute
- Subscribe to RSS Feed
- Permalink
Hi @ccueto36,
Could you please tell me if your problem has been solved? If it is, could you please mark the helpful replies as Answered?
Regards,
Daniel He
If this post helps, then please consider Accept it as the solution to help the other members find it more quickly.
- Mark as New
- Bookmark
- Subscribe
- Mute
- Subscribe to RSS Feed
- Permalink
Try this calculated column
Cal_charge+Amt =
VAR temp =
    TOPN (
        2,
        FILTER ( Table3, [Month-Year] < EARLIER ( [Month-Year] ) ),
        [Month-Year], DESC
    )
VAR temp1 =
    TOPN ( 1, temp, [Month-Year], ASC )
RETURN
    IF ( COUNTROWS ( temp ) = 2, MINX ( temp1, [Sum of ChargeAmt] ) )
Regards
Zubair
Please try my custom visuals
- Mark as New
- Bookmark
- Subscribe
- Mute
- Subscribe to RSS Feed
- Permalink
- Mark as New
- Bookmark
- Subscribe
- Mute
- Subscribe to RSS Feed
- Permalink
When I use it with a sample table it works
Please see Power Pivot model in attached Excel Workbook
Regards
Zubair
Please try my custom visuals
- Mark as New
- Bookmark
- Subscribe
- Mute
- Subscribe to RSS Feed
- Permalink
Thank you for the sample, I can also make it work just fine in Excel Power Pivot but the same does not seem to work in Power BI Calculated Column, keeps returning blank column 😕
- Mark as New
- Bookmark
- Subscribe
- Mute
- Subscribe to RSS Feed
- Permalink
Hi @ccueto36,
Based on my test, I have tried what Zubair suggested, it could work on my side, and you could also refer to my step:
Sample data:
Create a calculated column:
Column 2 = var a=MONTH('Table3'[Month-Year])-2
return CALCULATE(SUM(Table3[Sum of ChargeAmt]),FILTER('Table3',MONTH('Table3'[Month-Year])=a))
Result(Column1 is the Zubair's function):
You could also download the pbix to have a view, if it still could not work, could you please share the pbix if possible?
https://www.dropbox.com/s/jjdh69fw2ipjbr4/Offsetting%20Calculated%20Column%20Rows.pbix?dl=0
Regards,
Daniel He
If this post helps, then please consider Accept it as the solution to help the other members find it more quickly.

Helpful resources

FabCon & SQLCon – Barcelona 2026
Join us in Barcelona for FabCon and SQLCon, the Fabric, Power BI, SQL, and AI community event. Save €200 with code FABCMTY200.

Power BI DataViz World Championships - June 2026
A new Power BI DataViz World Championship is coming this June! Don't miss out on submitting your entry.

| User | Count |
|---|---|
| 21 | |
| 21 | |
| 14 | |
| 14 | |
| 13 |


| User | Count |
|---|---|
| 47 | |
| 35 | |
| 24 | |
| 20 | |
| 19 |


